Sample1. 1,2,18 Sample 2. 1, 2 9 Sample 3. 6, 5, 3, 14 a) Calculate the...
Sample1. 1,2,18
Sample 2. 1, 2 9
Sample 3. 6, 5, 3, 14
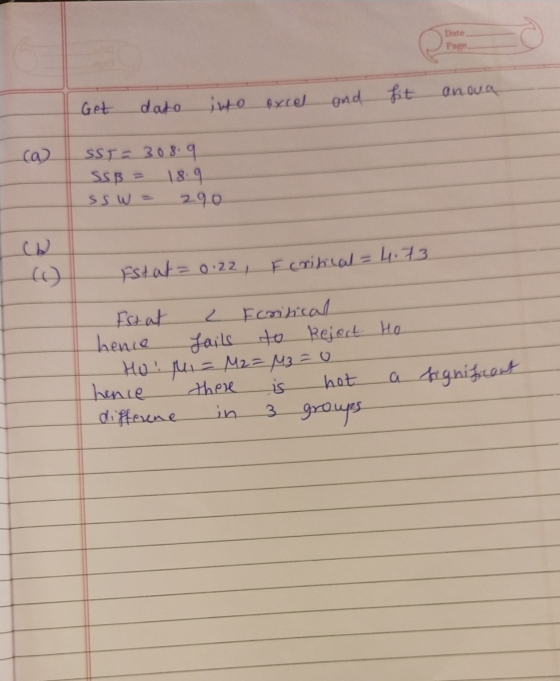
a) Calculate the total sum of squares (SST) and partition the SST into its two components, the sum of squares between (SSB) and the sum of squares within (SSW). 2 2 5 18 9 3 14
b) Use these values to construct a one-way ANOVA table.
c) Using α=0.10, what conclusions can be made concerning the population means?
Homework Answers

Add Answer to:
Sample1. 1,2,18
Sample 2. 1, 2 9
Sample 3. 6, 5, 3, 14
a) Calculate the...
Consider the data in the table collected from three independent populations. Sample 1 Sample 2 Sample...
 Consider the data in the table collected from three independent populations. Sample 1 Sample 2 Sample 3 a) Calculate the total sum of squares (SST) and partition the SST into its two components, the sum of squares between (SSB) and the sum of squares within (SS) b) Use these values to construct a one-way ANOVA table c) using α-0.05, what conclusions can be made concerning the population means? 14 Click the lcon to view a table of critical F-scores for...
This Question: 1 pt 2 of 9 (0 complete) This Quiz: 9 pts possible Consider the...
 This Question: 1 pt 2 of 9 (0 complete) This Quiz: 9 pts possible Consider the data in the table collected from three independent populations. Sample 1 Sample 2 Sample 3 a) Calculate the total sum af squs(SST) and partition the SST into its two components, the sum of squares between (SSB) and the sum of squares within (SSW). b) Use these values to construct a one-way ANOVA table. c) Using α=0.10, what conclusions can be made concerning the population...
Consider the data in the table collected from four independent populations. Sample Sample Sample Sample 1...
 Consider the data in the table collected from four independent populations. Sample Sample Sample Sample 1 2 4 17 16 10 4 11 20 5 a) Calculate the total sum of squares (SST). b) Partition the SST into its two components, the sum of squares between (SSB) and the sum of squares within (SSW) c) Using a 0.05, what conclusions can be made concerning the population means? 14 23 3 9 Click the icon to view a table of critical...
Falls/ does not fall, Reject/do not reject, Provide/do not provide Consider the data in the table...
 Falls/ does not fall,
Reject/do not reject, Provide/do not provide
Consider the data in the table collected from three independent populations. Sample 1 Sample 2 Sample 3 III a) Calculate the total sum of squares (SST) and partition the SST into its two components, the sum of squares between (SSB) and the sum of squares within (SSW) b) Use these values to construct a one- way ANOVA table c) Using a 0.05, what conclusions can be made concerning the population...
Falls/ does not fall,
Reject/do not reject, Provide/do not provide
Consider the data in the table collected from three independent populations. Sample 1 Sample 2 Sample 3 III a) Calculate the total sum of squares (SST) and partition the SST into its two components, the sum of squares between (SSB) and the sum of squares within (SSW) b) Use these values to construct a one- way ANOVA table c) Using a 0.05, what conclusions can be made concerning the population...
Consider the accompanying dala collected for a randomized block ANOVA Complete parts a) through d) below...
 Consider the accompanying dala collected for a randomized block ANOVA Complete parts a) through d) below EB Click the kcon to view the data Click the icon to view a table of critical F-scores ) Calculate the total sum of squares (SST) SST-(Round to two decimal places as needed) b) Partion the total sum of squares (SST) into its three components More Info Block Sample 1 Sample 2 Sample 3 Sample 4 10 Round to two dedimal places as nended)...
Topic: ANOVA Topic: ANOVA 1- An experiment was conducted using a randomized block design. The data...
Topic: ANOVA Topic: ANOVA 1- An experiment was conducted using a randomized block design. The data from the experiment are displayed in the following table. Block Treatment 1 2 3 1 2 3 5 2 8 6 7 3 7 6 5 a) Fill in the missing entries in the ANOVA table. Source df SS MS F Treatment 2 21.5555 Block 2 Error 4 Total 8 30.2222 b) Specify the null use to investigate whether a difference exists among the...
Consider the partially completed cne-way ANOVA summary table below. a) Complete the remaining entries in the...
 Consider the partially completed cne-way ANOVA summary table below. a) Complete the remaining entries in the table. b) How many population means are being tested? c) Using α-0.05, what conclusions can be made concerning the population means? Source Between Within Total Sum of Squares De of Freedom Mean Sum of Squares 112 193 19 Click the icon to view a table of critical F-sccres for a 0.05. a) Complete the ANOVA table below. Sum of Degrees of Mean Sum of...
The statistics lecture room is divided into three sections: front, middle, and back. The instructor noticed...
 The statistics lecture room is divided into three sections: front, middle, and back. The instructor noticed that the further the students were from her, the more likely they were to miss class, arrive late or text during class. She wanted to see if the students who sit further away did worse on tests so she took a random sample of students from each section and recorded their percentage mark on the second test. Percentage Mark on Second Test Front Middle...
PLEASE ANSWER A THROUGH C PLEASE der the partially completed one-way ANOVA summary table below the...
 PLEASE ANSWER A THROUGH C PLEASE
der the partially completed one-way ANOVA summary table below the remaining entries in the table. Sum of Squares Degrees of Freedom Mean Sum of Squares b) How many population means are being tested? c) Using a 0.05, what conclusions can be made concerning the Within Total 84 164 17 Click the icon to view a table of critical F-scores for ? = 0.05. a) C the ANOVA table below Sum of Degrees of Mean...
PLEASE ANSWER A THROUGH C PLEASE
der the partially completed one-way ANOVA summary table below the remaining entries in the table. Sum of Squares Degrees of Freedom Mean Sum of Squares b) How many population means are being tested? c) Using a 0.05, what conclusions can be made concerning the Within Total 84 164 17 Click the icon to view a table of critical F-scores for ? = 0.05. a) C the ANOVA table below Sum of Degrees of Mean...
An experiment has a sinale factor with 3 aroups and 5 values in each aroup. In...
 An experiment has a sinale factor with 3 aroups and 5 values in each aroup. In determining the among-group variation, there are 2 degrees of freedom. In determining the within-group variation, there are12 degrees of freedom In determining the total variation, there are14degrees of freedom. Also, note that SSA = 42 SsW 84, SST= 126, MSA = 21, MSW = 7, and FSTAT = 3. Complete parts (a) through (d). a. Construct the ANOVA summary table and fill in all...
 Consider the data in the table collected from three independent populations. Sample 1 Sample 2 Sample 3 a) Calculate the total sum of squares (SST) and partition the SST into its two components, the sum of squares between (SSB) and the sum of squares within (SS) b) Use these values to construct a one-way ANOVA table c) using α-0.05, what conclusions can be made concerning the population means? 14 Click the lcon to view a table of critical F-scores for...
 This Question: 1 pt 2 of 9 (0 complete) This Quiz: 9 pts possible Consider the data in the table collected from three independent populations. Sample 1 Sample 2 Sample 3 a) Calculate the total sum af squs(SST) and partition the SST into its two components, the sum of squares between (SSB) and the sum of squares within (SSW). b) Use these values to construct a one-way ANOVA table. c) Using α=0.10, what conclusions can be made concerning the population...
 Consider the data in the table collected from four independent populations. Sample Sample Sample Sample 1 2 4 17 16 10 4 11 20 5 a) Calculate the total sum of squares (SST). b) Partition the SST into its two components, the sum of squares between (SSB) and the sum of squares within (SSW) c) Using a 0.05, what conclusions can be made concerning the population means? 14 23 3 9 Click the icon to view a table of critical...
 Falls/ does not fall,
Reject/do not reject, Provide/do not provide
Consider the data in the table collected from three independent populations. Sample 1 Sample 2 Sample 3 III a) Calculate the total sum of squares (SST) and partition the SST into its two components, the sum of squares between (SSB) and the sum of squares within (SSW) b) Use these values to construct a one- way ANOVA table c) Using a 0.05, what conclusions can be made concerning the population...
Falls/ does not fall,
Reject/do not reject, Provide/do not provide
Consider the data in the table collected from three independent populations. Sample 1 Sample 2 Sample 3 III a) Calculate the total sum of squares (SST) and partition the SST into its two components, the sum of squares between (SSB) and the sum of squares within (SSW) b) Use these values to construct a one- way ANOVA table c) Using a 0.05, what conclusions can be made concerning the population...
 Consider the accompanying dala collected for a randomized block ANOVA Complete parts a) through d) below EB Click the kcon to view the data Click the icon to view a table of critical F-scores ) Calculate the total sum of squares (SST) SST-(Round to two decimal places as needed) b) Partion the total sum of squares (SST) into its three components More Info Block Sample 1 Sample 2 Sample 3 Sample 4 10 Round to two dedimal places as nended)...
 Consider the partially completed cne-way ANOVA summary table below. a) Complete the remaining entries in the table. b) How many population means are being tested? c) Using α-0.05, what conclusions can be made concerning the population means? Source Between Within Total Sum of Squares De of Freedom Mean Sum of Squares 112 193 19 Click the icon to view a table of critical F-sccres for a 0.05. a) Complete the ANOVA table below. Sum of Degrees of Mean Sum of...
 The statistics lecture room is divided into three sections: front, middle, and back. The instructor noticed that the further the students were from her, the more likely they were to miss class, arrive late or text during class. She wanted to see if the students who sit further away did worse on tests so she took a random sample of students from each section and recorded their percentage mark on the second test. Percentage Mark on Second Test Front Middle...
 PLEASE ANSWER A THROUGH C PLEASE
der the partially completed one-way ANOVA summary table below the remaining entries in the table. Sum of Squares Degrees of Freedom Mean Sum of Squares b) How many population means are being tested? c) Using a 0.05, what conclusions can be made concerning the Within Total 84 164 17 Click the icon to view a table of critical F-scores for ? = 0.05. a) C the ANOVA table below Sum of Degrees of Mean...
PLEASE ANSWER A THROUGH C PLEASE
der the partially completed one-way ANOVA summary table below the remaining entries in the table. Sum of Squares Degrees of Freedom Mean Sum of Squares b) How many population means are being tested? c) Using a 0.05, what conclusions can be made concerning the Within Total 84 164 17 Click the icon to view a table of critical F-scores for ? = 0.05. a) C the ANOVA table below Sum of Degrees of Mean...
 An experiment has a sinale factor with 3 aroups and 5 values in each aroup. In determining the among-group variation, there are 2 degrees of freedom. In determining the within-group variation, there are12 degrees of freedom In determining the total variation, there are14degrees of freedom. Also, note that SSA = 42 SsW 84, SST= 126, MSA = 21, MSW = 7, and FSTAT = 3. Complete parts (a) through (d). a. Construct the ANOVA summary table and fill in all...
Most questions answered within 3 hours.
-
A statistics student finds herself struggling with a newspaper
article stating that only eighteen percent of...
asked 18 minutes ago -
People with beriberi, a disease caused by a thiamin deficiency,
have elevated levels of blood pyruvate...
asked 5 minutes ago -
PYTHON Programming Exercise 2: Create a Simple Cost Calculator
Write a program that displays input fields...
asked 11 minutes ago -
1.Seki agreed that Groupon could sell 18 hot air
balloon rides on his Magical Adventures company...
asked 12 minutes ago -
A cohort study is conducted to determine whether smoking is
associated with an increased risk of...
asked 18 minutes ago -
Create the pseudo-code/flowchart for an application class named
Monogram. Its main() method inputs three variables that...
asked 18 minutes ago -
How many liters of water are required to dissolve 1.00 g of
silver chromate? Express your...
asked 21 minutes ago -
Hot: T_inlet = 80, T_out = 65
Cold: T_inlet = 10, T_out = 25
Explain in...
asked 21 minutes ago -
Two protons fly in different directions and collide. They both
have a total energy of 1.5...
asked 31 minutes ago -
What is the oxidation number of each atom in sodium phosphate,
Na3PO4?
>>> SHOW YOUR WORK...
asked 37 minutes ago -
D company purchased goods with a list price of $60000, subject
to trade discounts of 20%...
asked 39 minutes ago -
Transposable elements make up more than 40% of the human genome
and are inserted more-or-less randomly...
asked 50 minutes ago