


Homework Answers
For the given data using Anova single factor in Excel we get output as
| Anova: Single Factor | ||||||
| SUMMARY | ||||||
| Groups | Count | Sum | Average | Variance | ||
| sample 1 | 3 | 18 | 6 | 7 | ||
| sample 2 | 3 | 12 | 4 | 7 | ||
| sample 3 | 4 | 20 | 5 | 36.66667 | ||
| ANOVA | ||||||
| Source of Variation | SS | df | MS | F | P-value | F crit |
| Between Groups | 6 | 2 | 3 | 0.152174 | 0.861605 | 4.737414 |
| Within Groups | 138 | 7 | 19.71429 | |||
| Total | 144 | 9 |
So from the above output
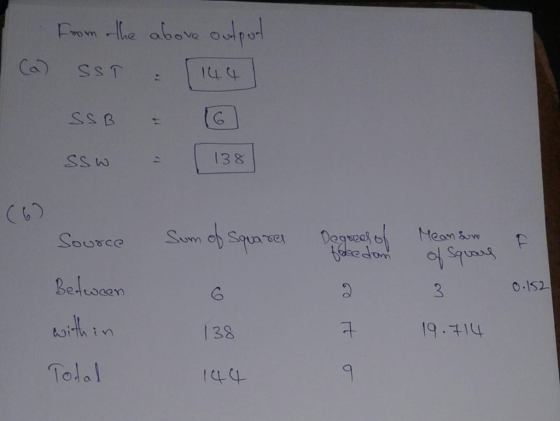
( c ) at alpha = 0.05 l.o.s f critical value = 4.737
Decision :
F CAL < F CRITICAL
i.e ., 0.152 < 4.737
so fail to reject H0
the population means are equal ( same )
Add Answer to:
Consider the data in the table collected from three independent populations. Sample 1 Sample 2 Sample...
Consider the data in the table collected from four independent populations. Sample Sample Sample Sample 1...
 Consider the data in the table collected from four independent populations. Sample Sample Sample Sample 1 2 4 17 16 10 4 11 20 5 a) Calculate the total sum of squares (SST). b) Partition the SST into its two components, the sum of squares between (SSB) and the sum of squares within (SSW) c) Using a 0.05, what conclusions can be made concerning the population means? 14 23 3 9 Click the icon to view a table of critical...
Falls/ does not fall, Reject/do not reject, Provide/do not provide Consider the data in the table...
 Falls/ does not fall,
Reject/do not reject, Provide/do not provide
Consider the data in the table collected from three independent populations. Sample 1 Sample 2 Sample 3 III a) Calculate the total sum of squares (SST) and partition the SST into its two components, the sum of squares between (SSB) and the sum of squares within (SSW) b) Use these values to construct a one- way ANOVA table c) Using a 0.05, what conclusions can be made concerning the population...
Falls/ does not fall,
Reject/do not reject, Provide/do not provide
Consider the data in the table collected from three independent populations. Sample 1 Sample 2 Sample 3 III a) Calculate the total sum of squares (SST) and partition the SST into its two components, the sum of squares between (SSB) and the sum of squares within (SSW) b) Use these values to construct a one- way ANOVA table c) Using a 0.05, what conclusions can be made concerning the population...
This Question: 1 pt 2 of 9 (0 complete) This Quiz: 9 pts possible Consider the...
 This Question: 1 pt 2 of 9 (0 complete) This Quiz: 9 pts possible Consider the data in the table collected from three independent populations. Sample 1 Sample 2 Sample 3 a) Calculate the total sum af squs(SST) and partition the SST into its two components, the sum of squares between (SSB) and the sum of squares within (SSW). b) Use these values to construct a one-way ANOVA table. c) Using α=0.10, what conclusions can be made concerning the population...
Sample1. 1,2,18 Sample 2. 1, 2 9 Sample 3. 6, 5, 3, 14 a) Calculate the...
Sample1. 1,2,18 Sample 2. 1, 2 9 Sample 3. 6, 5, 3, 14 a) Calculate the total sum of squares (SST) and partition the SST into its two components, the sum of squares between (SSB) and the sum of squares within (SSW). 2 2 5 18 9 3 14 b) Use these values to construct a one-way ANOVA table. c) Using α=0.10, what conclusions can be made concerning the population means?
The data shown to the right are from independent simple random samples from three populations. Use...
 The data shown to the right are from independent simple random samples from three populations. Use these data to complete parts (a) through (d). Sample 1 Sample 2 Sample 3 Click the icon to view a table of values of Fa Calculate SST, SSTR, and SSE using the computing formulas. SST = SSTR= SSE (Type an integer or a decimal. Do not round.) (Type an integer or a decimal. Do not round.) (Type an integer or a decimal. Do not...
PLEASE ANSWER A THROUGH C PLEASE der the partially completed one-way ANOVA summary table below the...
 PLEASE ANSWER A THROUGH C PLEASE
der the partially completed one-way ANOVA summary table below the remaining entries in the table. Sum of Squares Degrees of Freedom Mean Sum of Squares b) How many population means are being tested? c) Using a 0.05, what conclusions can be made concerning the Within Total 84 164 17 Click the icon to view a table of critical F-scores for ? = 0.05. a) C the ANOVA table below Sum of Degrees of Mean...
PLEASE ANSWER A THROUGH C PLEASE
der the partially completed one-way ANOVA summary table below the remaining entries in the table. Sum of Squares Degrees of Freedom Mean Sum of Squares b) How many population means are being tested? c) Using a 0.05, what conclusions can be made concerning the Within Total 84 164 17 Click the icon to view a table of critical F-scores for ? = 0.05. a) C the ANOVA table below Sum of Degrees of Mean...
Mean Square (Variance) Degrees of Sum of Source Freedom Squares Consider an experiment with nine groups, with eight val...
 Mean Square (Variance) Degrees of Sum of Source Freedom Squares Consider an experiment with nine groups, with eight values in each. For the ANOVA summary table shown to the right, fill in all the missing results. Among FSTAT ? MSA 22 SSA ? c-1 ? groups Within MSW ? SSW 693 n c groups Total SST ? n-1 2 Complete the ANOVA summary table below. Degrees of Freedom Sum of Mean Square (Variance) MSA 22 Source Squares FSTAT Among groups...
The data in the accompanying table indicate the driving distance, in yards, from a random sample...
 The data in the accompanying table indicate the driving distance, in yards, from a random sample of drives for three golfers a. Perform a one-way ANOVA using a 0.05 to determine if there is a difference in the average driving distance these three players b. Perform a multiple comparison test to determine which pairs are different using 0.05. EEE Click the icon to view the data table Click the icon to view a table of critical values for the studentized...
Consider the partially completed cne-way ANOVA summary table below. a) Complete the remaining entries in the...
 Consider the partially completed cne-way ANOVA summary table below. a) Complete the remaining entries in the table. b) How many population means are being tested? c) Using α-0.05, what conclusions can be made concerning the population means? Source Between Within Total Sum of Squares De of Freedom Mean Sum of Squares 112 193 19 Click the icon to view a table of critical F-sccres for a 0.05. a) Complete the ANOVA table below. Sum of Degrees of Mean Sum of...
Consider the partially completed one-way ANOVA summary table below. a) Complete the remaining entries in the...
 Consider the partially completed one-way ANOVA summary table below. a) Complete the remaining entries in the table. b) How many population means are being tested? c) Using a = 0.05, what conclusions can be made concerning the population means? Sum of Squares Degrees of Freedom Mean Sum of Squares w Source Between Within Total Click the icon to view a table of critical F-scores for a = 0.05. a) Complete the ANOVA table below. Sum of Degrees of Mean Sum...
 Consider the data in the table collected from four independent populations. Sample Sample Sample Sample 1 2 4 17 16 10 4 11 20 5 a) Calculate the total sum of squares (SST). b) Partition the SST into its two components, the sum of squares between (SSB) and the sum of squares within (SSW) c) Using a 0.05, what conclusions can be made concerning the population means? 14 23 3 9 Click the icon to view a table of critical...
 Falls/ does not fall,
Reject/do not reject, Provide/do not provide
Consider the data in the table collected from three independent populations. Sample 1 Sample 2 Sample 3 III a) Calculate the total sum of squares (SST) and partition the SST into its two components, the sum of squares between (SSB) and the sum of squares within (SSW) b) Use these values to construct a one- way ANOVA table c) Using a 0.05, what conclusions can be made concerning the population...
Falls/ does not fall,
Reject/do not reject, Provide/do not provide
Consider the data in the table collected from three independent populations. Sample 1 Sample 2 Sample 3 III a) Calculate the total sum of squares (SST) and partition the SST into its two components, the sum of squares between (SSB) and the sum of squares within (SSW) b) Use these values to construct a one- way ANOVA table c) Using a 0.05, what conclusions can be made concerning the population...
 This Question: 1 pt 2 of 9 (0 complete) This Quiz: 9 pts possible Consider the data in the table collected from three independent populations. Sample 1 Sample 2 Sample 3 a) Calculate the total sum af squs(SST) and partition the SST into its two components, the sum of squares between (SSB) and the sum of squares within (SSW). b) Use these values to construct a one-way ANOVA table. c) Using α=0.10, what conclusions can be made concerning the population...
 The data shown to the right are from independent simple random samples from three populations. Use these data to complete parts (a) through (d). Sample 1 Sample 2 Sample 3 Click the icon to view a table of values of Fa Calculate SST, SSTR, and SSE using the computing formulas. SST = SSTR= SSE (Type an integer or a decimal. Do not round.) (Type an integer or a decimal. Do not round.) (Type an integer or a decimal. Do not...
 PLEASE ANSWER A THROUGH C PLEASE
der the partially completed one-way ANOVA summary table below the remaining entries in the table. Sum of Squares Degrees of Freedom Mean Sum of Squares b) How many population means are being tested? c) Using a 0.05, what conclusions can be made concerning the Within Total 84 164 17 Click the icon to view a table of critical F-scores for ? = 0.05. a) C the ANOVA table below Sum of Degrees of Mean...
PLEASE ANSWER A THROUGH C PLEASE
der the partially completed one-way ANOVA summary table below the remaining entries in the table. Sum of Squares Degrees of Freedom Mean Sum of Squares b) How many population means are being tested? c) Using a 0.05, what conclusions can be made concerning the Within Total 84 164 17 Click the icon to view a table of critical F-scores for ? = 0.05. a) C the ANOVA table below Sum of Degrees of Mean...
 Mean Square (Variance) Degrees of Sum of Source Freedom Squares Consider an experiment with nine groups, with eight values in each. For the ANOVA summary table shown to the right, fill in all the missing results. Among FSTAT ? MSA 22 SSA ? c-1 ? groups Within MSW ? SSW 693 n c groups Total SST ? n-1 2 Complete the ANOVA summary table below. Degrees of Freedom Sum of Mean Square (Variance) MSA 22 Source Squares FSTAT Among groups...
 The data in the accompanying table indicate the driving distance, in yards, from a random sample of drives for three golfers a. Perform a one-way ANOVA using a 0.05 to determine if there is a difference in the average driving distance these three players b. Perform a multiple comparison test to determine which pairs are different using 0.05. EEE Click the icon to view the data table Click the icon to view a table of critical values for the studentized...
 Consider the partially completed cne-way ANOVA summary table below. a) Complete the remaining entries in the table. b) How many population means are being tested? c) Using α-0.05, what conclusions can be made concerning the population means? Source Between Within Total Sum of Squares De of Freedom Mean Sum of Squares 112 193 19 Click the icon to view a table of critical F-sccres for a 0.05. a) Complete the ANOVA table below. Sum of Degrees of Mean Sum of...
 Consider the partially completed one-way ANOVA summary table below. a) Complete the remaining entries in the table. b) How many population means are being tested? c) Using a = 0.05, what conclusions can be made concerning the population means? Sum of Squares Degrees of Freedom Mean Sum of Squares w Source Between Within Total Click the icon to view a table of critical F-scores for a = 0.05. a) Complete the ANOVA table below. Sum of Degrees of Mean Sum...
Most questions answered within 3 hours.
-
The condensate from a steam distillation contains 12.0 g of
compound A and 18.0 g of...
asked 1 hour ago -
A major economic benefit of fixed exchange rates compared to
floating rates is that
a. the...
asked 1 hour ago -
1) For this reaction,
SiCl4 (l)+ 2H2O(g) <->
SiO2 (s) + 4HCl (g) DeltaH = -127 KJ...
asked 1 hour ago -
Which of the following does NOT add to US GDP? A. Saudi Arabia
buys fighter jets...
asked 3 hours ago -
2. Describe market equilibrium in terms of the following
characteristics
d.
How supply and demand interactions...
asked 3 hours ago -
1a. Create a class named Computer
- Separate declaration from implementation (i.e. Header and CPP
files)...
asked 3 hours ago -
A medical researcher
believes that a drug changes the body's temperature. Seven test
subjects are randomly...
asked 3 hours ago -
A call option on Project Cash Flow Consulting Inc.'s stock (PCF)
has a market price of...
asked 4 hours ago -
A study on the latest fad diet claimed that the amounts of
weight lost by all...
asked 4 hours ago -
give examples of how gene expression is inherited to the next
generation?
asked 4 hours ago -
If a project has _________ IRR(s), we should __________ . Assume
this project is competing with...
asked 4 hours ago -
In the figure, a sound of wavelength 0.700 m is emitted
isotropically by point source S....
asked 4 hours ago