

Homework Answers
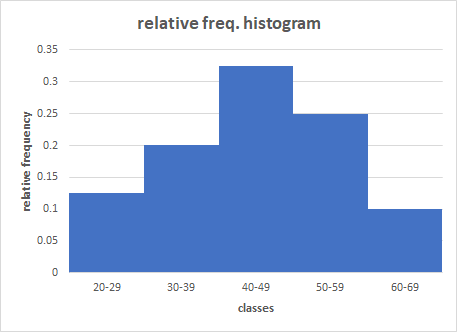
| class | relative freq. |
| 20-29 | 0.125 |
| 30-39 | 0.2 |
| 40-49 | 0.325 |
| 50-59 | 0.25 |
| 60-69 | 0.1 |
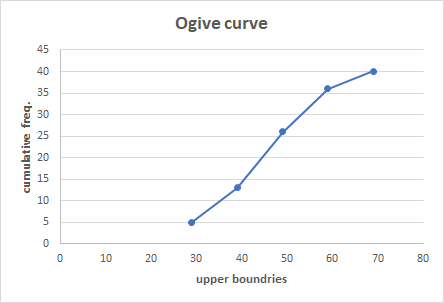
| class | upper boundry | cumulative freq. |
| 20-29 | 29 | 5 |
| 30-39 | 39 | 13 |
| 40-49 | 49 | 26 |
| 50-59 | 59 | 36 |
| 60-69 | 69 | 40 |
| class | mid ponit | freq. |
| 20-29 | 24.5 | 5 |
| 30-39 | 34.5 | 8 |
| 40-49 | 44.5 | 13 |
| 50-59 | 54.5 | 10 |
| 60-69 | 64.5 | 4 |


Add Answer to:
please help with letters D-G
1. Forty workers were randomly surveyed about how long it takes...
please help with letters G & H and number 3 letters A-C 2. The incomplete frequency...
 please help with letters G & H and number 3 letters
A-C
2. The incomplete frequency distribution table given below represents the score of an exam in a math class. (a) (5 points) Complete the frequency distribution table below Class Class Class Cumulative Percentage Limits Boundaries Midpoint Frequency Frequency Frequency 154.5, 55 — 67 61 4 167.5 4 Class 110,000 122.50% 9 13 40.00% 68 - 80 180.5 174 81 - 93 180.s, 187 16 29 23.5 93.5 94-106 40...
please help with letters G & H and number 3 letters
A-C
2. The incomplete frequency distribution table given below represents the score of an exam in a math class. (a) (5 points) Complete the frequency distribution table below Class Class Class Cumulative Percentage Limits Boundaries Midpoint Frequency Frequency Frequency 154.5, 55 — 67 61 4 167.5 4 Class 110,000 122.50% 9 13 40.00% 68 - 80 180.5 174 81 - 93 180.s, 187 16 29 23.5 93.5 94-106 40...
Question 1 (30 marks) The scores of 60 students in a test are: 58 49 48...
Question 1 (30 marks) The scores of 60 students in a test are: 58 49 48 62 50 76 61 82 60 72 70 35 61 55 82 66 50 47 36 58 84 55 68 32 62 58 48 75 80 49 55 67 71 46 40 57 69 70 52 60 48 53 42 68 54 60 63 70 72 68 42 55 36 70 36 82 66 46 59 50 (i) Find the mean score of the...
estimate the average age at which multiple sclerosis patients were diagnosed with the condition for the...
estimate the average age at which multiple sclerosis patients were diagnosed with the condition for the first time in a given city. How big should the sample be? Define your procedures for this estimate (if necessary, set your own values of unknown parameters, based on statistical theory). In Table 1 you will find all ages of this patient population. 54 58 56 48 62 59 55 56 60 52 53 61 56 56 53 37 71 62 39 61 54...
1. Descriptive Statistics Data 20 25 40 41 42 43 44 45 46 47 48 49...
 1. Descriptive Statistics Data 20 25 40 41 42 43 44 45 46 47 48 49 50 50 51 52 53 54 55 56 57 58 59 60 65 80 90 For the data above calculate and draw the following: a. A Frequency Diagram with 7 classes. b. A Histogram C. A Stem and Leaf Diagram. Don't forget the instruction. d. The Five Number Summary e. The Box and Whisker Plot which needs the IQR, the Lower Fence and Upper...
The following data represents the age of 30 lottery winners. 20 31 33 33 34 35...
The following data represents the age of 30 lottery winners. 20 31 33 33 34 35 35 39 41 42 44 47 48 49 52 52 53 53 56 58 59 60 61 61 63 63 63 70 72 86 Complete the frequency distribution for the data. Age Frequency 20-29 30-39 40-49 50-59 60-69 70-79 80-89
2:33 LTE X Statistics first homework.pdf 1 Descriptive Statistics Data 20 25 40 41 42 43...
 2:33 LTE X Statistics first homework.pdf 1 Descriptive Statistics Data 20 25 40 41 42 43 44 45 46 47 48 49 50 50 51 52 53 54 55 56 57 58 59 60 65 80 90 For the data above calculate and draw the following: a. A Frequency Diagram with 7 classes b.A Histogram A Stem and Leaf Diagram. Don't forget the instruction d. The Five Number Summary e. The Box and Whisker Plot which needs the IQR, the...
In a d stribution where the mean 60 and the standard deviation is 3 find the...
 In a d stribution where the mean 60 and the standard deviation is 3 find the largest fraction of the numbers that could meet the following requirements of the numbers in the distribution, the fraction that is less than 45 or more than 75 is at most (Type an integer or simplitied fraction ) LI ess than 45 or more than 75 58 61 63 56 55 50 56 62 54 scores of the 54 members of a sociology lecture...
Q1) Twenty six smokers were surveyed to ascertain the number of cigarettes each smoked for a 1 we...
 please answer 1 and 2 in detail
Q1) Twenty six smokers were surveyed to ascertain the number of cigarettes each smoked for a 1 weelk period. The results are as follows: 44 39 37 21 31 28 44 29 30 52 40 20 24 32 22 27 50 43 26 37 26 51 34 27 33 25 Create a frequency distribution with 5 classes using the headings: #ofcigarettes. Frequency(), Cumulative Frequency (c), and relative frequency (r). Show details of your...
please answer 1 and 2 in detail
Q1) Twenty six smokers were surveyed to ascertain the number of cigarettes each smoked for a 1 weelk period. The results are as follows: 44 39 37 21 31 28 44 29 30 52 40 20 24 32 22 27 50 43 26 37 26 51 34 27 33 25 Create a frequency distribution with 5 classes using the headings: #ofcigarettes. Frequency(), Cumulative Frequency (c), and relative frequency (r). Show details of your...
The following data represents the age of 30 lottery winners. 22 26 26 31 38 38...
The following data represents the age of 30 lottery winners. 22 26 26 31 38 38 42 44 44 44 45 46 48 50 51 51 52 54 55 60 62 63 71 71 73 75 78 79 80 86 Complete the frequency distribution for the data. Age Frequency 20-29 30-39 40-49 50-59 60-69 70-79 80-89
can you upload the answer in excel 7. Following are ages of 30 students in an...
 can you upload the answer in excel
7. Following are ages of 30 students in an ARC Boot Camp class: 18 30 20 21 28 26 20 21 19 22 26 38 18 19 23 25 19 20 18 21 29 35 17 22 19 24 23 21 20 25 Construct an expanded stem-and-leaf display for the given data. Stem Leaves 2. The following data values are the actual low temperatures recorded near the author's home. Construct a frequency distribution...
can you upload the answer in excel
7. Following are ages of 30 students in an ARC Boot Camp class: 18 30 20 21 28 26 20 21 19 22 26 38 18 19 23 25 19 20 18 21 29 35 17 22 19 24 23 21 20 25 Construct an expanded stem-and-leaf display for the given data. Stem Leaves 2. The following data values are the actual low temperatures recorded near the author's home. Construct a frequency distribution...
 please help with letters G & H and number 3 letters
A-C
2. The incomplete frequency distribution table given below represents the score of an exam in a math class. (a) (5 points) Complete the frequency distribution table below Class Class Class Cumulative Percentage Limits Boundaries Midpoint Frequency Frequency Frequency 154.5, 55 — 67 61 4 167.5 4 Class 110,000 122.50% 9 13 40.00% 68 - 80 180.5 174 81 - 93 180.s, 187 16 29 23.5 93.5 94-106 40...
please help with letters G & H and number 3 letters
A-C
2. The incomplete frequency distribution table given below represents the score of an exam in a math class. (a) (5 points) Complete the frequency distribution table below Class Class Class Cumulative Percentage Limits Boundaries Midpoint Frequency Frequency Frequency 154.5, 55 — 67 61 4 167.5 4 Class 110,000 122.50% 9 13 40.00% 68 - 80 180.5 174 81 - 93 180.s, 187 16 29 23.5 93.5 94-106 40...
 1. Descriptive Statistics Data 20 25 40 41 42 43 44 45 46 47 48 49 50 50 51 52 53 54 55 56 57 58 59 60 65 80 90 For the data above calculate and draw the following: a. A Frequency Diagram with 7 classes. b. A Histogram C. A Stem and Leaf Diagram. Don't forget the instruction. d. The Five Number Summary e. The Box and Whisker Plot which needs the IQR, the Lower Fence and Upper...
 2:33 LTE X Statistics first homework.pdf 1 Descriptive Statistics Data 20 25 40 41 42 43 44 45 46 47 48 49 50 50 51 52 53 54 55 56 57 58 59 60 65 80 90 For the data above calculate and draw the following: a. A Frequency Diagram with 7 classes b.A Histogram A Stem and Leaf Diagram. Don't forget the instruction d. The Five Number Summary e. The Box and Whisker Plot which needs the IQR, the...
 In a d stribution where the mean 60 and the standard deviation is 3 find the largest fraction of the numbers that could meet the following requirements of the numbers in the distribution, the fraction that is less than 45 or more than 75 is at most (Type an integer or simplitied fraction ) LI ess than 45 or more than 75 58 61 63 56 55 50 56 62 54 scores of the 54 members of a sociology lecture...
 please answer 1 and 2 in detail
Q1) Twenty six smokers were surveyed to ascertain the number of cigarettes each smoked for a 1 weelk period. The results are as follows: 44 39 37 21 31 28 44 29 30 52 40 20 24 32 22 27 50 43 26 37 26 51 34 27 33 25 Create a frequency distribution with 5 classes using the headings: #ofcigarettes. Frequency(), Cumulative Frequency (c), and relative frequency (r). Show details of your...
please answer 1 and 2 in detail
Q1) Twenty six smokers were surveyed to ascertain the number of cigarettes each smoked for a 1 weelk period. The results are as follows: 44 39 37 21 31 28 44 29 30 52 40 20 24 32 22 27 50 43 26 37 26 51 34 27 33 25 Create a frequency distribution with 5 classes using the headings: #ofcigarettes. Frequency(), Cumulative Frequency (c), and relative frequency (r). Show details of your...
 can you upload the answer in excel
7. Following are ages of 30 students in an ARC Boot Camp class: 18 30 20 21 28 26 20 21 19 22 26 38 18 19 23 25 19 20 18 21 29 35 17 22 19 24 23 21 20 25 Construct an expanded stem-and-leaf display for the given data. Stem Leaves 2. The following data values are the actual low temperatures recorded near the author's home. Construct a frequency distribution...
can you upload the answer in excel
7. Following are ages of 30 students in an ARC Boot Camp class: 18 30 20 21 28 26 20 21 19 22 26 38 18 19 23 25 19 20 18 21 29 35 17 22 19 24 23 21 20 25 Construct an expanded stem-and-leaf display for the given data. Stem Leaves 2. The following data values are the actual low temperatures recorded near the author's home. Construct a frequency distribution...
Most questions answered within 3 hours.
-
Suppose that you know that in the population of full-time
employees in the United States, the...
asked 24 seconds ago -
This experiment was designed originally to sample various meat and carcass quality
aspects of Ontario pigs...
asked 54 seconds ago -
) Raw materials are studied for contamination. Suppose that
the number of particles of contamination per...
asked 15 minutes ago -
After running a regression analysis we calculated an F test and
the significance level was 0.15....
asked 10 minutes ago -
----Can someone please help me solve this one using JAVA
----I thank you in advance
Create...
asked 15 minutes ago -
1. What force primarily attracts the potassium ion to
the nitrate ion?
a. London forces...
asked 17 minutes ago -
What are the negative effects of abruptly stopping the use of
all fossil fuels? Give at...
asked 23 minutes ago -
Given that many conflict are the result of different parties having
different interests, is it possible...
asked 28 minutes ago -
A 750 g block can slide uniformly along the horizontal track
when a string attached to...
asked 31 minutes ago -
In 2017, Juan entered into a contract to write a book. The
publisher advanced Juan $50,000,...
asked 45 minutes ago -
Determine the number of kinds of protons in each molecule (w/
respect to NMR spectroscopy). Drawing...
asked 55 minutes ago -
A jeweler whose near point is 68 cm from his eye uses a
magnifying glass as...
asked 53 minutes ago