
Homework Answers

2 | 05
3 |
4 | 0123456789
5 | 00123456789
6 | 05
7 |
8 | 0
9 | 0
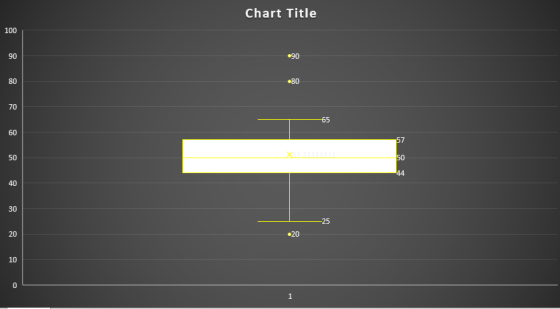
Min. 1st Qu. Median Mean 3rd Qu. Max.
20.00 44.50 50.00 51.11 56.50 90.00
Add Answer to:
1. Descriptive Statistics Data 20 25 40 41 42 43 44 45 46 47 48 49...
2:33 LTE X Statistics first homework.pdf 1 Descriptive Statistics Data 20 25 40 41 42 43...
 2:33 LTE X Statistics first homework.pdf 1 Descriptive Statistics Data 20 25 40 41 42 43 44 45 46 47 48 49 50 50 51 52 53 54 55 56 57 58 59 60 65 80 90 For the data above calculate and draw the following: a. A Frequency Diagram with 7 classes b.A Histogram A Stem and Leaf Diagram. Don't forget the instruction d. The Five Number Summary e. The Box and Whisker Plot which needs the IQR, the...
5) Given the data array 32 33 35 39 40 41 42 42 43 45 49...
 5) Given the data array 32 33 35 39 40 41 42 42 43 45 49 78 93 a) Give Five Number Summary b) Draw a boxplot. c) Calculate the InterQuartile Range, the Upper Fence, the Lower Fence d) Check for outliers
Consider the following box-and- whisker plot. Htt 34 36 38 40 42 44 46 48 50...
 Consider the following box-and- whisker plot. Htt 34 36 38 40 42 44 46 48 50 52 54 56 58 Determine the following values. Please type your solution in the text entry boxes provided. e. The value of the maximum is - (Use the form XX) f. The value of the median is - (Use the form XX) g. The value of the range is - (Use the form XX) h. The value of the interquartile range is - (Use...
4) Consider the following data: 125 Points] 70 44 36 53 38 48 56 35 46...
 4) Consider the following data: 125 Points] 70 44 36 53 38 48 56 35 46 70 56 53 49 58 70 56 70 51 48 33 38 82 45 70 a) Calculate the sample mean and the median of the above data sct. b) Calculate the five number summary c) Compute the 60s and 90 percentile from the data d) Summarize the data given above using a stem-and-leaf plot.
Given the following data, complete the following 64 47 33 61 &nb
Given the following data, complete the following 64 47 33 61 43 13 74 50 41 42 66 65 54 61 49 1 25 32 61 Create leaf and stem (3pts) Create a frequency distribution with 4 classes (label everything) Range Find the mode Find the mean Find the variance Find the standard deviation (5pts) Find Tukey’s five number summery Create a box and whisker plot Find the IQR Prove there are any outliers or not
48 57 Amy Bakery has four shops in different area in a city. Monthly sales (in...
 48 57 Amy Bakery has four shops in different area in a city. Monthly sales (in thousands of dollars) from a random of 24 months from each of the 4 shops given in Table 1. Table 1: Monthly sales (in thousands of dollars) North East South West 77 75 97 60 45 42 60 54 56 49 68 47 44 39 58 57 63 61 69 51 75 63 79 50 90 81 99 73 32 47 46 41 41...
1 and 2 1) For the data listed below as the questions (a) to (d). DATA:...
 1 and 2
1) For the data listed below as the questions (a) to (d). DATA: 20 25 40 41 42 43 44 45 46 47 48 49 50 50 51 52 53 54 55 56 57 58 59 60 65 80 90 Questions Points a)Make a frequency diagram with 7 classes b) Make a histogram c) Give the five number summary d) Make a box-and-whisker diagram (show outliers.) 2) At a gathering of 190 college students their grade-group and...
1 and 2
1) For the data listed below as the questions (a) to (d). DATA: 20 25 40 41 42 43 44 45 46 47 48 49 50 50 51 52 53 54 55 56 57 58 59 60 65 80 90 Questions Points a)Make a frequency diagram with 7 classes b) Make a histogram c) Give the five number summary d) Make a box-and-whisker diagram (show outliers.) 2) At a gathering of 190 college students their grade-group and...
1. Consider the following data: 18, 20, 25, 31, 32, 38, 39, 40, 43, 49, 51,...
1. Consider the following data: 18, 20, 25, 31, 32, 38, 39, 40, 43, 49, 51, 54, 65, 74 Use 4 classes. a. Class width : b. Complete the following table. ????? ?????? ????? − ????? Class Boundaries Midpoint Frequencies Relative Frequencies Cumulative Frequencies c. Draw a histogram. d. Draw a relative frequency histogram. e. Make a stem-and-leaf display. f. Find the interquartile range. g. Make a box-and-whisker plot. h. Determine the distribution shape. Please comment on all three plots....
#1 Toss Results 1 25 5 - 49 N 3 ZG 3 So 3 3 Z...
 #1 Toss Results 1 25 5 - 49 N 3 ZG 3 So 3 3 Z 22 6 S1 2 4 3 28 6 5 2 52 5 29 6 6 6 5 30 54 2 7 2 31 5 SS 4 8 4 32 56 5 9 1 33 الما 57 lo 34 58 11 4 t 35 59 G N 12 36 2 60 6 13 5 37 3 19 4 38 Outcome fozquency 15 39 - 16...
6. The following stem-and-leaf diagram gives the number of patents held by each of a sample...
 6. The following stem-and-leaf diagram gives the number of
patents held by each of a sample of 36 public and private U.S.
universities.
A- I
6. The following stem-and-leaf diagram gives the number of patents held by each of a sample of 36 public and private U.S. universities. 0 223 4799 1 11145566689 2 023479 3 004355 419 a) What is the shape of the distribution? Explain. b) What percentage of universities in the sample hold at least 50 patents?...
6. The following stem-and-leaf diagram gives the number of
patents held by each of a sample of 36 public and private U.S.
universities.
A- I
6. The following stem-and-leaf diagram gives the number of patents held by each of a sample of 36 public and private U.S. universities. 0 223 4799 1 11145566689 2 023479 3 004355 419 a) What is the shape of the distribution? Explain. b) What percentage of universities in the sample hold at least 50 patents?...
 2:33 LTE X Statistics first homework.pdf 1 Descriptive Statistics Data 20 25 40 41 42 43 44 45 46 47 48 49 50 50 51 52 53 54 55 56 57 58 59 60 65 80 90 For the data above calculate and draw the following: a. A Frequency Diagram with 7 classes b.A Histogram A Stem and Leaf Diagram. Don't forget the instruction d. The Five Number Summary e. The Box and Whisker Plot which needs the IQR, the...
 5) Given the data array 32 33 35 39 40 41 42 42 43 45 49 78 93 a) Give Five Number Summary b) Draw a boxplot. c) Calculate the InterQuartile Range, the Upper Fence, the Lower Fence d) Check for outliers
 Consider the following box-and- whisker plot. Htt 34 36 38 40 42 44 46 48 50 52 54 56 58 Determine the following values. Please type your solution in the text entry boxes provided. e. The value of the maximum is - (Use the form XX) f. The value of the median is - (Use the form XX) g. The value of the range is - (Use the form XX) h. The value of the interquartile range is - (Use...
 4) Consider the following data: 125 Points] 70 44 36 53 38 48 56 35 46 70 56 53 49 58 70 56 70 51 48 33 38 82 45 70 a) Calculate the sample mean and the median of the above data sct. b) Calculate the five number summary c) Compute the 60s and 90 percentile from the data d) Summarize the data given above using a stem-and-leaf plot.
 48 57 Amy Bakery has four shops in different area in a city. Monthly sales (in thousands of dollars) from a random of 24 months from each of the 4 shops given in Table 1. Table 1: Monthly sales (in thousands of dollars) North East South West 77 75 97 60 45 42 60 54 56 49 68 47 44 39 58 57 63 61 69 51 75 63 79 50 90 81 99 73 32 47 46 41 41...
 1 and 2
1) For the data listed below as the questions (a) to (d). DATA: 20 25 40 41 42 43 44 45 46 47 48 49 50 50 51 52 53 54 55 56 57 58 59 60 65 80 90 Questions Points a)Make a frequency diagram with 7 classes b) Make a histogram c) Give the five number summary d) Make a box-and-whisker diagram (show outliers.) 2) At a gathering of 190 college students their grade-group and...
1 and 2
1) For the data listed below as the questions (a) to (d). DATA: 20 25 40 41 42 43 44 45 46 47 48 49 50 50 51 52 53 54 55 56 57 58 59 60 65 80 90 Questions Points a)Make a frequency diagram with 7 classes b) Make a histogram c) Give the five number summary d) Make a box-and-whisker diagram (show outliers.) 2) At a gathering of 190 college students their grade-group and...
 #1 Toss Results 1 25 5 - 49 N 3 ZG 3 So 3 3 Z 22 6 S1 2 4 3 28 6 5 2 52 5 29 6 6 6 5 30 54 2 7 2 31 5 SS 4 8 4 32 56 5 9 1 33 الما 57 lo 34 58 11 4 t 35 59 G N 12 36 2 60 6 13 5 37 3 19 4 38 Outcome fozquency 15 39 - 16...
 6. The following stem-and-leaf diagram gives the number of
patents held by each of a sample of 36 public and private U.S.
universities.
A- I
6. The following stem-and-leaf diagram gives the number of patents held by each of a sample of 36 public and private U.S. universities. 0 223 4799 1 11145566689 2 023479 3 004355 419 a) What is the shape of the distribution? Explain. b) What percentage of universities in the sample hold at least 50 patents?...
6. The following stem-and-leaf diagram gives the number of
patents held by each of a sample of 36 public and private U.S.
universities.
A- I
6. The following stem-and-leaf diagram gives the number of patents held by each of a sample of 36 public and private U.S. universities. 0 223 4799 1 11145566689 2 023479 3 004355 419 a) What is the shape of the distribution? Explain. b) What percentage of universities in the sample hold at least 50 patents?...
Most questions answered within 3 hours.
-
In 1970s and 1980s, molecular biologists discovered that the
hormone testosterone, binds a receptor protein that...
asked 1 hour ago -
january 1 2010 road catering service purchase a piece of
equipment for 58000 which is expected...
asked 2 hours ago -
Explain Mertons concept of anomie is and what the
modes of adaptation to it are?
asked 2 hours ago -
Jamie is doing a survey at her school about whether the students
feel the cafeteria food...
asked 4 hours ago -
How many liters of 0.669 M KOH will be needed to raise the pH of
0.339...
asked 6 hours ago -
A liquid of density 1270 kg/m 3 flows steadily through a pipe of
varying diameter and...
asked 6 hours ago -
Questions: What should the American executive do?
'A visiting American executive finds that a foreign subsidiary...
asked 6 hours ago -
Activity based costing was introduced as an alternative to
absorption costing.
1. Discuss using illustration the...
asked 6 hours ago -
1. You own shares of Crane DVD Company and are interested in
selling them. With so...
asked 6 hours ago -
How many grams of He are necessary to fill a balloon having a
volume of 4.5E3...
asked 6 hours ago -
The 2 patients, still in the hospital, were interviewed by a
MoH epidemiologist. The interviews revealed...
asked 6 hours ago -
An uncharged capacitor and a resistor are connected in series to
a source of emf. If...
asked 7 hours ago