Given the following data, complete the following 64 47 33 61 &nb
Given the following data, complete the following
64 47 33 61 43 13 74 50 41 42
66 65 54 61 49 1 25 32 61
- Create leaf and stem
- (3pts) Create a frequency distribution with 4 classes (label everything)
- Range
- Find the mode
- Find the mean
- Find the variance
- Find the standard deviation
- (5pts) Find Tukey’s five number summery
- Create a box and whisker plot
- Find the IQR
- Prove there are any outliers or not
Homework Answers
Number of observations, n = 19
The Stem – Leaf plot is given below –
|
Stem |
Leaf |
|
0 |
1 |
|
1 |
3 |
|
2 |
5 |
|
3 |
2, 3 |
|
4 |
1, 2, 3, 7, 9 |
|
5 |
0, 4 |
|
6 |
1, 1, 1, 4, 5, 6 |
|
7 |
4 |
The frequency distribution is given below –
|
Classes |
Frequency |
|
1-20 |
2 |
|
21-40 |
3 |
|
41-60 |
7 |
|
61-80 |
7 |
|
Total |
19 |
The Range of the data set = Maximum value – Minimum value = 74 – 1 = 73
Mode is that value of the data set that is repeated the maximum number of times.
Mode = 61 (repeated thrice)
The Excel Output of the following data set is given below -

Therefore,
Mean = 46.421
Variance = 347.402
Standard Deviation = 18.6387
and the formulas used are -

where B1 and B19 are the cell numbers
Therefore,
Tukey's Five Number Summary is -
Maximum Value = 74
Minimum Value = 1
Median of the data set = 10th Observation
From the Leaf – Stem plot the 10th Observation is 49
First/Lower quartile of the data set is the median of the first half of the data set (that is the first 9 observations)
First Quartile = 5th Observation = 33
Third/Upper quartile of the data set is the median of the next half of the data set (that is from 11th observation to last observation)
Third Quartile = 5th Observation
Taking 11th Observation as the first Observation and counting from there-on,
5th Observation = 61
The Box - Whisker plot is given below -
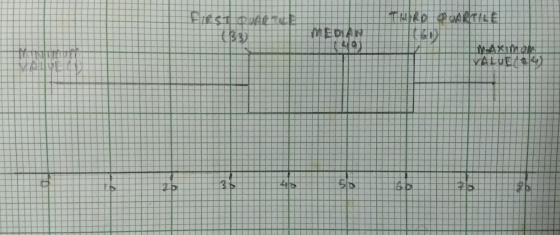
Inter Quartile Range (IQR) = Third Quartile – First Quartile = 61 – 33 = 28
To calculate for outliers,
We multiply 1.5 to the IQR. Let p = 1.5 x IQR. Then we add the value p to the Third Quartile and also subtract p from the First Quartile to get a range.
If all the values of the data set lie inside this range then there are no outliers in the data set.
Therefore, p = 1.5 x 28 = 42
(p + Third Quartile) = 42 + 61 = 103
(Lower Quartile - p) = 33 – 42 = -9
The range of the data set is [-9, 103].
Since, all the values of the data set lie in this range there are no outliers in the data set.
(Since, nothing is mentioned the mean, variance and standard deviation are calculated in excel)
2:33 LTE X Statistics first homework.pdf 1 Descriptive Statistics Data 20 25 40 41 42 43...
 2:33 LTE X Statistics first homework.pdf 1 Descriptive Statistics Data 20 25 40 41 42 43 44 45 46 47 48 49 50 50 51 52 53 54 55 56 57 58 59 60 65 80 90 For the data above calculate and draw the following: a. A Frequency Diagram with 7 classes b.A Histogram A Stem and Leaf Diagram. Don't forget the instruction d. The Five Number Summary e. The Box and Whisker Plot which needs the IQR, the...
1. Descriptive Statistics Data 20 25 40 41 42 43 44 45 46 47 48 49...
 1. Descriptive Statistics Data 20 25 40 41 42 43 44 45 46 47 48 49 50 50 51 52 53 54 55 56 57 58 59 60 65 80 90 For the data above calculate and draw the following: a. A Frequency Diagram with 7 classes. b. A Histogram C. A Stem and Leaf Diagram. Don't forget the instruction. d. The Five Number Summary e. The Box and Whisker Plot which needs the IQR, the Lower Fence and Upper...
Presidents Ages (44 of them): 57 61 57 57 58 57 61 54 68 51 49...
Presidents Ages (44 of them): 57 61 57 57 58 57 61 54 68 51 49 64 50 48 65 52 56 46 54 49 51 47 55 55 54 42 51 56 55 51 54 51 60 62 43 55 56 61 52 69 64 46 54 47 Please answer Question D the last one: Quartile Q1: 51 Quartile Q2: 54.5 Quartile Q3: 57.5 IQR= 6.5 Lower fence = 41.25 Upper fence = 67.25 d. Use the fences from...
Please answer completely! 6 Q032 Stem and Leaf Pages 63-64 a. Create a stem-and-leaf plot for...
 Please answer completely!
6 Q032 Stem and Leaf Pages 63-64 a. Create a stem-and-leaf plot for the following 34 numbers. (6 points) 9 75 17 42 45 86 70 41 41 15 66 33 10 45 93 20 42 77 52 75 23 26 55 44 44 44 73 17 39 26 86 81 65 42 b. Draw a Box-and-whisker plot for the same data set. Show the 5-Number summary and IQR. (6 points)
Please answer completely!
6 Q032 Stem and Leaf Pages 63-64 a. Create a stem-and-leaf plot for the following 34 numbers. (6 points) 9 75 17 42 45 86 70 41 41 15 66 33 10 45 93 20 42 77 52 75 23 26 55 44 44 44 73 17 39 26 86 81 65 42 b. Draw a Box-and-whisker plot for the same data set. Show the 5-Number summary and IQR. (6 points)
estimate the average age at which multiple sclerosis patients were diagnosed with the condition for the...
estimate the average age at which multiple sclerosis patients were diagnosed with the condition for the first time in a given city. How big should the sample be? Define your procedures for this estimate (if necessary, set your own values of unknown parameters, based on statistical theory). In Table 1 you will find all ages of this patient population. 54 58 56 48 62 59 55 56 60 52 53 61 56 56 53 37 71 62 39 61 54...
Listed below are the heights from a sample of male students (in inches). 75 72 72...
Listed below are the heights from a sample of male students (in inches). 75 72 72 73 74 65 69 74 70 70 71 75 71 75 69 75 78 70 [3 pts]Create an ordered stem and leaf display for these data. [1 pt] How many students are measured? [1 pt] What percentage of students are at least 70”? (Round to 1 decimal place.) 2. As of 2017, the following are the ages, in chronological order, at which the last...
Find the mean, median, and mode for each set of numbers. (If necessary, round your answers...
Find the mean, median, and mode for each set of numbers. (If necessary, round your answers to one decimal place. If an answer does not exist, enter DNE.) (a) 69, 68, 55, 69, 54, 51, 64, 57, 69 mean median mode (b) 75, 49, 56, 35, 49, 33, 76, 70, 48 mean median mode 2. he scatter plot shows how long it took different numbers of workers to do the same job. (a) How many hours did it take the crew of...
Consider the below matrixA, which you can copy and paste directly into Matlab.
Problem #1: Consider the below matrix A, which you can copy and paste directly into Matlab. The matrix contains 3 columns. The first column consists of Test #1 marks, the second column is Test # 2 marks, and the third column is final exam marks for a large linear algebra course. Each row represents a particular student.A = [36 45 75 81 59 73 77 73 73 65 72 78 65 55 83 73 57 78 84 31 60 83...
The following scores represent the final examination grades for an elementary statistics course:
The following scores represent the final examination grades for an elementary statistics course: 23 60 79 32 57 74 52 70 82 36 80 77 81 95 41 65 92 85 55 76 52 10 64 75 78 25 80 98 81 67 41 71 83 54 64 72 88 62 74 43 60 78 89 76 84 48 84 90 15 79 34 67 17 82 69 74 63 80 85 61 Calculate: Stem and leaf Relative frequency histogram Cumulative frequency Sample Mean Sample Median Mode Variance Standard deviation
Problem 1: Confidence Interval for Percentage of B’s. The data set “STAT 250 Final Exam Scores”...
Problem 1: Confidence Interval for Percentage of B’s. The data set “STAT 250 Final Exam Scores” contains a random sample of 269 STAT 250 students’ final exam scores (maximum of 80) collected over the past two years. Answer the following questions using this data set. a) What proportion of students in our sample earned B’s on the final exam? A letter grade of B is obtained with a score of between 64 and 71 inclusive. Hint: You can do this...
 2:33 LTE X Statistics first homework.pdf 1 Descriptive Statistics Data 20 25 40 41 42 43 44 45 46 47 48 49 50 50 51 52 53 54 55 56 57 58 59 60 65 80 90 For the data above calculate and draw the following: a. A Frequency Diagram with 7 classes b.A Histogram A Stem and Leaf Diagram. Don't forget the instruction d. The Five Number Summary e. The Box and Whisker Plot which needs the IQR, the...
 1. Descriptive Statistics Data 20 25 40 41 42 43 44 45 46 47 48 49 50 50 51 52 53 54 55 56 57 58 59 60 65 80 90 For the data above calculate and draw the following: a. A Frequency Diagram with 7 classes. b. A Histogram C. A Stem and Leaf Diagram. Don't forget the instruction. d. The Five Number Summary e. The Box and Whisker Plot which needs the IQR, the Lower Fence and Upper...
 Please answer completely!
6 Q032 Stem and Leaf Pages 63-64 a. Create a stem-and-leaf plot for the following 34 numbers. (6 points) 9 75 17 42 45 86 70 41 41 15 66 33 10 45 93 20 42 77 52 75 23 26 55 44 44 44 73 17 39 26 86 81 65 42 b. Draw a Box-and-whisker plot for the same data set. Show the 5-Number summary and IQR. (6 points)
Please answer completely!
6 Q032 Stem and Leaf Pages 63-64 a. Create a stem-and-leaf plot for the following 34 numbers. (6 points) 9 75 17 42 45 86 70 41 41 15 66 33 10 45 93 20 42 77 52 75 23 26 55 44 44 44 73 17 39 26 86 81 65 42 b. Draw a Box-and-whisker plot for the same data set. Show the 5-Number summary and IQR. (6 points)
Most questions answered within 3 hours.
-
Assume that in the short run L = 1,000 and K = 100. 1. What is...
asked 2 minutes ago -
At a given temperature, 2.06 atm of H2 and 3.7 atm of Br2 are
mixed and...
asked 1 minute ago -
Sodium reacts with Hydrochloric acid to form sodium chloride and
hydrogen gas. 2Na(s)+ 2 HCl(aq)-> 2...
asked 8 minutes ago -
4) In a polypeptide, which bond cannot rotate because of its
partial double bond character?
The...
asked 7 minutes ago -
The following circuits (1 & 2) are combined to form a
series-parallel circuit and resulting circuit...
asked 15 minutes ago -
Feynman's use of path integrals can make some of the transition
from quantum scale to real...
asked 14 minutes ago -
Pb(NO3)2 (aq) + 2 KCl (aq) PbCl2 (s) + 2 KNO3 (aq)
If 54.5mL of 3.82M...
asked 15 minutes ago -
Razeghi (2008) states "In order to succeed at innovation, do not
focus on being creative; rather...
asked 22 minutes ago -
How much heat is required at constant pressure to melt 1 mole of
ice at -25...
asked 25 minutes ago -
Suppose N is a discrete random variable defined by probability
distribution:
n
Pr(N = n)
10...
asked 25 minutes ago -
why are special-interest travelers becoming more important to
tourism service suppliers?
asked 29 minutes ago -
A 50.0-kg child takes a ride on a Ferris wheel that rotates four
times each minute...
asked 52 minutes ago