1. Consider the following data: 18, 20, 25, 31, 32, 38, 39, 40, 43, 49, 51,...
1. Consider the following data:
18, 20, 25, 31, 32, 38, 39, 40, 43, 49, 51, 54, 65, 74 Use 4 classes.
a. Class width :
b. Complete the following table.
|
????? ?????? ????? − ????? |
Class Boundaries |
Midpoint |
Frequencies |
Relative Frequencies |
Cumulative Frequencies |
c. Draw a histogram.
d. Draw a relative frequency histogram.
e. Make a stem-and-leaf display.
f. Find the interquartile range.
g. Make a box-and-whisker plot.
h. Determine the distribution shape. Please comment on all three plots.
i. Draw an ogive.
j. Find the mean.
k. Find the median.
l. Find the mode.
m. Find the variance.
n. Find the coefficient of variation.
2. Consider the following data:
|
x |
13 |
11 |
8 |
6 |
5 |
3 |
|
y |
2 |
5 |
7 |
6 |
4 |
2 |
a. ?̅ =
b. ?4 =
c. ? 7 =
d. ? 8 =
e. ? =
f. Make a scatter plot displaying the data.
g. Graph the least-squares line on your scatter plot.
h. What is the equation of the least-squares line.
i. What the value of the coefficient of determination ? : .
j. Interpret the coefficient of determination.
k. Predict y for x = 9.
3. A box contains 4 marbles, 1 red, 1 green, and 1 blue, 1 yellow. Describe the sample space of the following experiments.
a. Take 1 marble from the box, then replace it in the box and draw a second marble from the box.
b. Take 1 marble from the box, without replacing it, draw a second marble from the box.
4. A pair of fair dice are rolled. What is the probability that the second die lands on a higher value than does the first?
5. Two cards are chosen at random from a deck of 52 playing cards. What is the probability that they
a. both are aces
b. have the same value?
6. If a die is rolled 2 times, what is the probability that 5 comes at least once?
7. Urn A contains 3 red and 3 black balls, whereas urn B contains 4 red and 6 black balls. If a ball is randomly selected from each urn, what is the probability that the balls will be the same color?
8. Event A occurs with probability 0.2 and event B occurs with probability 0.5. Assume A and B are independent.
a. Find ?(? ??? ?)
b. Find ?(?|?)
c. Find ?(?|?).
9. A die with 8 sides is rolled. What is the probability of rolling a number less than 5?
10. Given the bivariate sample, (? E , ? E ), (? : , ? : ), … . . , (? H , ? H ) , suppose ? 7 =1, ? 8 = 6,
E ?̅ = 2, ?4 = 3, ? = . What is the equation of the least squares line.
J
10. A study conducted at a certain college shows that 75% of the school’s graduates find a job in their chosen field within a year after graduation. Find the probability that among 3 randomly selected graduates, at least one finds a job in their chosen field within a year of graduating.
Homework Answers
1:
Following is the ordered data set:
| S.No. | Data |
| 1 | 18 |
| 2 | 20 |
| 3 | 25 |
| 4 | 31 |
| 5 | 32 |
| 6 | 38 |
| 7 | 39 |
| 8 | 40 |
| 9 | 43 |
| 10 | 49 |
| 11 | 51 |
| 12 | 54 |
| 13 | 65 |
| 14 | 74 |
We have:
Min = 18, Max = 74
Since we need 4 classes so class width should be
Class width =(Max-min) / 4 = (74-18) / 4 = 14
Let us assume class width 14+1=15. Following is the frequency distribution:

(c)
Following is the histogram:

(d)
Here we need to relative frequencies at y-axis. Following is the relative frequency histogram:

(e)
Following is the stem and leaf display:

(f)
There are 7 data values in the first half of data set. That is first quartile will be equal to 4th data value. So,

There are 7 data values in the second half of data set. That is third quartile will be equal to 11th data value. So,

The interquartile range will be

(g and k)
Median: There are 14 data values so median will be average of 7th and 8th data values That is

Following is the box and whisker plot:

(h)
Box plot shows that distribution is almost symmetric. It has no apparent outlier.
(i)
Following is the ogive:

(l)
Mode is the data value with highest frequency. Since all data values are unique so there is no mode of the data set.
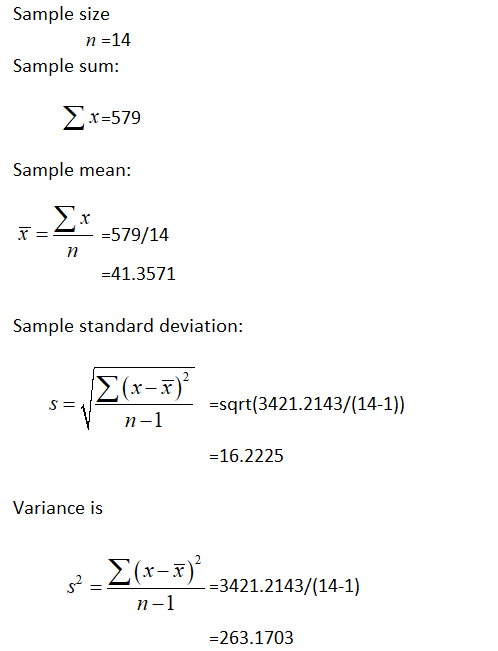
(j, m and n):
Following table shows the calculations:
| X | (X-mean)^2 | |
| 18 | 545.5541204 | |
| 20 | 456.1257204 | |
| 25 | 267.5547204 | |
| 31 | 107.2695204 | |
| 32 | 87.55532041 | |
| 38 | 11.27012041 | |
| 39 | 5.55592041 | |
| 40 | 1.84172041 | |
| 43 | 2.69912041 | |
| 49 | 58.41392041 | |
| 51 | 92.98552041 | |
| 54 | 159.8429204 | |
| 65 | 558.9867204 | |
| 74 | 1065.55892 | |
| Total | 579 | 3421.214286 |

Add Answer to:
1. Consider the following data:
18, 20, 25, 31, 32, 38, 39, 40, 43, 49, 51,...
1. The probability of a teenager owning a surfboard is .43, owning a skateboard is .38,...
1. The probability of a teenager owning a surfboard is .43, owning a skateboard is .38, and owning both is .28 If a teenager is selected at random, find the probability that he or she owns a surfboard or a skateboard. 2. In a class consisting of 15 men and 12 women, two homework papers were selected at random. Find the probability that both papers belong to women. 3. An urn contains 6 red balls, 2 green balls, 1 blue...
An experiment consists of choosing an urn with the following probabilities that Urn 1, Urn 2,...
An experiment consists of choosing an urn with the following probabilities that Urn 1, Urn 2, or Urn 3 will be chosen: 1/2, 1/4, and 1/4, respectively. Urn 1 contains 5 brown marbles and 11 clear marbles. Urn 2 contains 15 brown marbles, 7 clear marbles and 12 red marbles. Urn 3 contains 10 brown marbles, 13 clear marbles and 9 red marbles. A marble is then chosen from the chosen urn. What is the probability that Urn 3 was...
1. The following data represents the number of days absent and the final grade for a...
1. The following data represents the number of days absent and the final grade for a sample of college students in a general education course at a large state university. No. of absences 0 1 2 3 4 5 6 7 8 9 Final Grade 89.2 86.4 83.5 81.1 78.2 73.9 64.3 71.8 65.5 66.2 a) Which variable is the explanatory variable? b) Draw a scatter plot and describe your scatter plot (Direction, Strength, Form). c) Compute the correlation coefficient....
The following data represents the number of days absent and the final grade for a sample...
 The following data represents the number of days absent and the final grade for a sample of college students in a general education course at a large state university. 0 1 2 3 4 5 6 7 8 9 No. of absences Final Grade 89.2 86.4 83.5 81.1 78.2 73.9 64.3 71.8 65.5 66.2 a) Which variable is the explanatory variable? b) Draw a scatter plot and describe your scatter plot (Direction, Strength, Form). c) Compute the correlation coefficient d)...
Problem #8; Consider the following data 22, 25, 40, 37, 27, 32, 39 (a) If you...
 Problem #8; Consider the following data 22, 25, 40, 37, 27, 32, 39 (a) If you were to construct a normal probability plot by hand for the above data what are the numerical values (in order) of the first five numbers that would go on the x-axis? Separate your answers with a comma. (Read the last two pages of this example for a description of the normal probability plot.) For example, if your data was the same as the last...
Problem 1 A dance class consists of 22 students, of which 10 are women and 12...
 Problem 1 A dance class consists of 22 students, of which 10 are women and 12 are men. if 5 men and 5 women are to be chosen and then paired off, how many results are possible? Problem 2 A student is to answer 7 out of 10 questions in an examination. How many choices has she? How many if she must answer at least 3 of the first 5 questions? Problem 3 Prove that P(EnFc)-P(E)-P(EnF) Indicate the difference between...
Can you help with the following premises of probabilities? Please see image below. Thank you. Probability...
 Can you help with the following premises of probabilities?
Please see image below. Thank you.
Probability & Counting Methods 9. Determine the probability that an odd number will roll when rolling a die. 10. Determine the probability that a number greater than four (4) will roll when rolling a die. 11. Please determine the probability of a clover coming out when you draw a card from a deck. 12. If you have 20 red balls, 12 green balls, 15 yellow...
Can you help with the following premises of probabilities?
Please see image below. Thank you.
Probability & Counting Methods 9. Determine the probability that an odd number will roll when rolling a die. 10. Determine the probability that a number greater than four (4) will roll when rolling a die. 11. Please determine the probability of a clover coming out when you draw a card from a deck. 12. If you have 20 red balls, 12 green balls, 15 yellow...
1. Descriptive Statistics Data 20 25 40 41 42 43 44 45 46 47 48 49...
 1. Descriptive Statistics Data 20 25 40 41 42 43 44 45 46 47 48 49 50 50 51 52 53 54 55 56 57 58 59 60 65 80 90 For the data above calculate and draw the following: a. A Frequency Diagram with 7 classes. b. A Histogram C. A Stem and Leaf Diagram. Don't forget the instruction. d. The Five Number Summary e. The Box and Whisker Plot which needs the IQR, the Lower Fence and Upper...
1. Consider an urn with 4 blue balls, 6 red balls, and 3 yellow balls. Suppose...
 1. Consider an urn with 4 blue balls, 6 red balls, and 3 yellow balls. Suppose we draw 4 balls at random. (a) How many elements are in the sample space? (b) What is the probaiblity that we draw 4 red balls? (c) What is the probability that we draw 2 red balls and 2 blue balls? (d) What is the probability that we draw either 3 blue and 1 yellow ball or 1 blue and 3 yellow balls? 2....
Q1 ) A U Ac = Select one: a. S b. (A|B) c. P (A and...
Q1 ) A U Ac = Select one: a. S b. (A|B) c. P (A and B) = P (A∩B) d. A(OR)A e. P(A) ____________________________ Q2) wo dice are rolled, find the probability that the sum is less than 2 Select one: a. 1/36 b. 0/36 c. 2/36 d. 2/12 e. 4/12 ___________________________________ Q3) A die is rolled, find the probability that the number obtained is greater than 4 Select one: a. 0.167 b. 0% c. 50% d. 0.33 e....
 The following data represents the number of days absent and the final grade for a sample of college students in a general education course at a large state university. 0 1 2 3 4 5 6 7 8 9 No. of absences Final Grade 89.2 86.4 83.5 81.1 78.2 73.9 64.3 71.8 65.5 66.2 a) Which variable is the explanatory variable? b) Draw a scatter plot and describe your scatter plot (Direction, Strength, Form). c) Compute the correlation coefficient d)...
 Problem #8; Consider the following data 22, 25, 40, 37, 27, 32, 39 (a) If you were to construct a normal probability plot by hand for the above data what are the numerical values (in order) of the first five numbers that would go on the x-axis? Separate your answers with a comma. (Read the last two pages of this example for a description of the normal probability plot.) For example, if your data was the same as the last...
 Problem 1 A dance class consists of 22 students, of which 10 are women and 12 are men. if 5 men and 5 women are to be chosen and then paired off, how many results are possible? Problem 2 A student is to answer 7 out of 10 questions in an examination. How many choices has she? How many if she must answer at least 3 of the first 5 questions? Problem 3 Prove that P(EnFc)-P(E)-P(EnF) Indicate the difference between...
 Can you help with the following premises of probabilities?
Please see image below. Thank you.
Probability & Counting Methods 9. Determine the probability that an odd number will roll when rolling a die. 10. Determine the probability that a number greater than four (4) will roll when rolling a die. 11. Please determine the probability of a clover coming out when you draw a card from a deck. 12. If you have 20 red balls, 12 green balls, 15 yellow...
Can you help with the following premises of probabilities?
Please see image below. Thank you.
Probability & Counting Methods 9. Determine the probability that an odd number will roll when rolling a die. 10. Determine the probability that a number greater than four (4) will roll when rolling a die. 11. Please determine the probability of a clover coming out when you draw a card from a deck. 12. If you have 20 red balls, 12 green balls, 15 yellow...
 1. Descriptive Statistics Data 20 25 40 41 42 43 44 45 46 47 48 49 50 50 51 52 53 54 55 56 57 58 59 60 65 80 90 For the data above calculate and draw the following: a. A Frequency Diagram with 7 classes. b. A Histogram C. A Stem and Leaf Diagram. Don't forget the instruction. d. The Five Number Summary e. The Box and Whisker Plot which needs the IQR, the Lower Fence and Upper...
 1. Consider an urn with 4 blue balls, 6 red balls, and 3 yellow balls. Suppose we draw 4 balls at random. (a) How many elements are in the sample space? (b) What is the probaiblity that we draw 4 red balls? (c) What is the probability that we draw 2 red balls and 2 blue balls? (d) What is the probability that we draw either 3 blue and 1 yellow ball or 1 blue and 3 yellow balls? 2....
Most questions answered within 3 hours.
-
Self-Study Problem 12.3
Part a:
Linda filed her tax return 2 months late. The tax paid...
asked 6 minutes ago -
Assume that adults have IQ scores that are normally distributed
with a mean of µ =105...
asked 3 minutes ago -
1. How many MOLECULES of
boron trichloride are present in
8.03 grams of this compound ?...
asked 18 minutes ago -
var gArr = [
{food: 'apple', type: 'fruit'},
{food: 'potato', type: 'vegetable'},
{food: 'banana', type: 'fruit'}...
asked 26 minutes ago -
How can the four-speed of all material particles be
the speed of light even though they...
asked 23 minutes ago -
A broadband service offered by telephone companies that uses
copper wires already installed in homes and...
asked 20 minutes ago -
Most penguin species are not sexually dimorphic, which means
they lack obvious outward body characteristics which...
asked 38 minutes ago -
The equation for a firm’s short-run total cost is STC = 10 + 5q
+ 0.1q^2....
asked 53 minutes ago -
How can a cell gain energy while folding proteins in
the periplasm?
asked 1 hour ago -
Let X~UNIF(0,1), and Y=-lnX. Then what is the density function
of Y where nonzero?
asked 1 hour ago -
For the following Motivational Theories, please pick ONE THEORY
to answer the following 2 questions. (10...
asked 1 hour ago -
What is the energy change when the temperature of 11.7 grams
of gaseous xenon is decreased...
asked 1 hour ago