
Homework Answers
1. a) Frequency distribution:
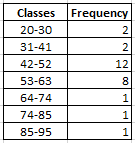
b) Histogram:

c) Five point summary:
Minimum: 20
Q1: (n+1)/4 th value = 7th value = 44
Median : (n+1)/2 th value = (27+1)/2 = 14th value = 50
Q3: 3(n+1)/4 th value = 21 st value = 57
Maximum:90
d) Box and whiskers plot:

2. Probability of a biology major = 70/190 = 0.3684
Probability of a biology major or an A-student = (70+50-20)/190 = 100/190 = 0.5263
Probability of a nursing major and a B-student = 30/190 = 0.1579
Probability of a nursing major or a biology major = (50+70)/190 = 120/190 = 0.6316
Probability of a math major and a biology major = 0/190 = 0
Probability of a accounting major given that they are an A-student = P(Account major and A-student)/P(A-student)
= (10/190) / (50/190) = 10/50 = 0.20
Probability of a B-student given that they are a math major = P(B-student and math major) / P(Math major)
= (10/190) / (30/190) = 10/30 = 0.333
----------
If you have any doubt, ask in comment section.
Add Answer to:
1 and 2
1) For the data listed below as the questions (a) to (d). DATA:...
3. Major Grade-GroupBiology Nursing Math 25 40 404 35 Accounting Total 35 25 15 20 A-Students...
 3. Major Grade-GroupBiology Nursing Math 25 40 404 35 Accounting Total 35 25 15 20 A-Students 15 40 10 15 15 25 B-Students C-Students D-Students 10 H-Students Total Given the above table, what is the probability that: (a)if a student is selected at random that the student is a math major? (b) ifa student is selected at random that the student is either a math major or a biology major? O if a student is selected at random that the...
1. Descriptive Statistics Data 20 25 40 41 42 43 44 45 46 47 48 49...
 1. Descriptive Statistics Data 20 25 40 41 42 43 44 45 46 47 48 49 50 50 51 52 53 54 55 56 57 58 59 60 65 80 90 For the data above calculate and draw the following: a. A Frequency Diagram with 7 classes. b. A Histogram C. A Stem and Leaf Diagram. Don't forget the instruction. d. The Five Number Summary e. The Box and Whisker Plot which needs the IQR, the Lower Fence and Upper...
2:33 LTE X Statistics first homework.pdf 1 Descriptive Statistics Data 20 25 40 41 42 43...
 2:33 LTE X Statistics first homework.pdf 1 Descriptive Statistics Data 20 25 40 41 42 43 44 45 46 47 48 49 50 50 51 52 53 54 55 56 57 58 59 60 65 80 90 For the data above calculate and draw the following: a. A Frequency Diagram with 7 classes b.A Histogram A Stem and Leaf Diagram. Don't forget the instruction d. The Five Number Summary e. The Box and Whisker Plot which needs the IQR, the...
The table below shows the number of male and female students enrolled in nursing at a university for a certain semester A student is parts (a) through (d) selected at random. Complete Tota...
 The table below shows the number of male and female students enrolled in nursing at a university for a certain semester A student is parts (a) through (d) selected at random. Complete Total 1108 2321 3429 Nursing majors Non-nursing majors 1013 1721 2734 Males Females Total 95 600 696 (a) Find the probability that the student is male or a nursing major. P(being male or being nursing major) Round to the nearest thousandth as needed) b) Find the probability that...
8. (10 points) The following spectra correspond to compounds AE listed below con pound to its...
 8. (10 points) The following spectra correspond to compounds AE listed below con pound to its corresponding spestre Label very simal on the spectrum (as Co . ctc.). Spectrum CDCI, 190 160 170 160 150 140 130 120 110 100 80 80 Spectrum 2 70 80 50 40 30 20 10 O le CDCI, 190 180 170 180 150 140 130 120 110 100 90 80 70 60 50 40 30 20 10 O de CDCI, 190 180 170 180...
Logic and Decision Making ALL questions below must be answered. Show ALL step-by-step calculation...
Logic and Decision Making ALL questions below must be answered. Show ALL step-by-step calculations, round all your final answers correctly, and include the units of measurement. Upload this modified Answer Form to the intellipath Unit 6 Submission lesson. Make sure that you submit your work in a modified MS Word document; handwritten work will not be accepted. If you need assistance, please contact your course instructor. A proposed directed study MATH125 class comprising 25 students earned the following grades on...
1 points Use the following data to answer the next three questions. A group of students...
 1 points Use the following data to answer the next three questions. A group of students are classified according to their gender and major. The results of this classification is presented in the following table Marketing Finance Accounting Cis Total Female 45 50 60 190 Male 60 70 50610 110 130 85400 1. If a student is selected at random, what is the probability that this student is male given that this student is majoring in Marketing 0.40 0.60 0.075...
Student #2 C- 72% 144 34 0 40 70 Student #3 74% C 148 40 10 43 55 Student # 4 50 36 A 93% 186 10 90 Student #5 B+ 87% 1...
 Student #2 C- 72% 144 34 0 40 70 Student #3 74% C 148 40 10 43 55 Student # 4 50 36 A 93% 186 10 90 Student #5 B+ 87% 174 48 10 46 70 Student #6 56% 112 44 5 28 35 Student #7 65 84% 168 50 10 43 Student #8 48 B- 80% 159 46 10 55 Student #9 C+ 79% 158 50 10 73 25 Student #10 86% 172 33 5 44 90 Student...
At a university, suppose 50% of students are biology majors, 25% are economics majors. Data is...
At a university, suppose 50% of students are biology majors, 25% are economics majors. Data is also collected on class: 40% are freshmen, 30% are sophomore, 20% are juniors, and the rest are seniors. Assume that there is no double majors student, A. Consider the % of students who are neither biology nor economics majors. This % must be between _ and _. B. If 30% of sophomores are economics majors, what % of students are sophomores and major in...
 3. Major Grade-GroupBiology Nursing Math 25 40 404 35 Accounting Total 35 25 15 20 A-Students 15 40 10 15 15 25 B-Students C-Students D-Students 10 H-Students Total Given the above table, what is the probability that: (a)if a student is selected at random that the student is a math major? (b) ifa student is selected at random that the student is either a math major or a biology major? O if a student is selected at random that the...
 1. Descriptive Statistics Data 20 25 40 41 42 43 44 45 46 47 48 49 50 50 51 52 53 54 55 56 57 58 59 60 65 80 90 For the data above calculate and draw the following: a. A Frequency Diagram with 7 classes. b. A Histogram C. A Stem and Leaf Diagram. Don't forget the instruction. d. The Five Number Summary e. The Box and Whisker Plot which needs the IQR, the Lower Fence and Upper...
 2:33 LTE X Statistics first homework.pdf 1 Descriptive Statistics Data 20 25 40 41 42 43 44 45 46 47 48 49 50 50 51 52 53 54 55 56 57 58 59 60 65 80 90 For the data above calculate and draw the following: a. A Frequency Diagram with 7 classes b.A Histogram A Stem and Leaf Diagram. Don't forget the instruction d. The Five Number Summary e. The Box and Whisker Plot which needs the IQR, the...
 The table below shows the number of male and female students enrolled in nursing at a university for a certain semester A student is parts (a) through (d) selected at random. Complete Total 1108 2321 3429 Nursing majors Non-nursing majors 1013 1721 2734 Males Females Total 95 600 696 (a) Find the probability that the student is male or a nursing major. P(being male or being nursing major) Round to the nearest thousandth as needed) b) Find the probability that...
 8. (10 points) The following spectra correspond to compounds AE listed below con pound to its corresponding spestre Label very simal on the spectrum (as Co . ctc.). Spectrum CDCI, 190 160 170 160 150 140 130 120 110 100 80 80 Spectrum 2 70 80 50 40 30 20 10 O le CDCI, 190 180 170 180 150 140 130 120 110 100 90 80 70 60 50 40 30 20 10 O de CDCI, 190 180 170 180...
 1 points Use the following data to answer the next three questions. A group of students are classified according to their gender and major. The results of this classification is presented in the following table Marketing Finance Accounting Cis Total Female 45 50 60 190 Male 60 70 50610 110 130 85400 1. If a student is selected at random, what is the probability that this student is male given that this student is majoring in Marketing 0.40 0.60 0.075...
 Student #2 C- 72% 144 34 0 40 70 Student #3 74% C 148 40 10 43 55 Student # 4 50 36 A 93% 186 10 90 Student #5 B+ 87% 174 48 10 46 70 Student #6 56% 112 44 5 28 35 Student #7 65 84% 168 50 10 43 Student #8 48 B- 80% 159 46 10 55 Student #9 C+ 79% 158 50 10 73 25 Student #10 86% 172 33 5 44 90 Student...
Most questions answered within 3 hours.
-
What are John’s potential claims if he is terminated
this week?
John is a 54-year-old man...
asked 46 seconds ago -
A (8.5) cm tall object is placed at a distance of (14.2) cm from
a convex...
asked 9 minutes ago -
(2) For the following questions, consider a data set that
exhibits a normal distribution. Report the...
asked 10 minutes ago -
What exactly is an information system? How does it work" What
are its people organization,
...
asked 11 minutes ago -
The Food Marketing Institute shows that 17% of households spend
more than $100 per week on...
asked 21 minutes ago -
Go to NCBI BLAST search web page
1st search: GEKDLRRAKDINQEVYNF
2nd search: PTSQRLQLLEPFDK
3rd search: GEKDLRRAKDINQEVYNF...
asked 24 minutes ago -
Explain how each of the following three conditions could be a
red flag for a register...
asked 29 minutes ago -
In a two-way factorial ANOVA, the final F-ratio for
factor AxB is determined by dividing _____...
asked 59 minutes ago -
Show your solutions for answer.
4. An aqueous solution contains 9.21 g of
K4Fe(CN)6 in a...
asked 29 minutes ago -
The random variable X has a uniform distribution with values
between 16 and 18. What is...
asked 39 minutes ago -
Evaluate each of the following transactions in terms of their
effect on assets, liabilities, and equity....
asked 38 minutes ago -
The amounts of nicotine in a certain brand of cigarette are
normally distributed with a mean...
asked 58 minutes ago