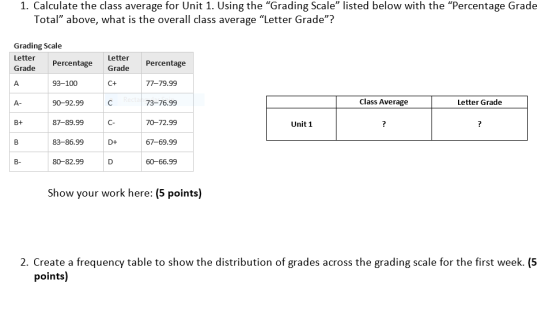

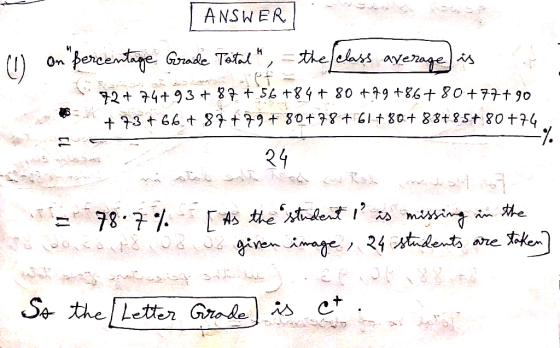
1. Calculate the class average for Unit 1. Using the "Grading Scale" listed below with the "Percentage Grade Total" above, what is the overall class average "Letter Grade"? Grading Scale Letter Letter Percentage Percentage Grade Grade 77-79.99 A 93-100 C+ Class Average Letter Grade A. 90-92.99 C 73-76.99 B+ 87-89.99 C 70-72.99 Unit 1 ? B 83-86.99 D+ 67-69.99 B- 80-82.99 D 60-66.99 Show your work here: (5 points) 2. Create a frequency table to show the distribution of grades across the grading scale for the first week. (5 points)
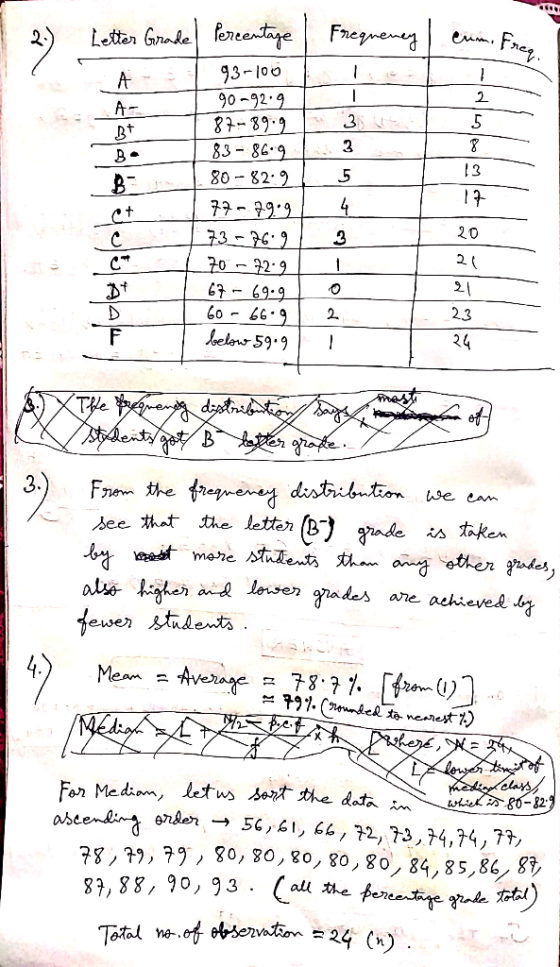
Cumulative Frequency Frequency Letter Grade Percentage ? ? A 93-100 ? A- 90-92.9 ? ? Bt 87-89.9 83-86.9 ? ? 80-82.9 ? B- 77-79.9 C+ 73-76.9 ? ? C ? C- 70-72.9 ? Dt 67-69.9 ? D 60-66.9 Below 59.9 ? F 3. Describe what you see based on the frequency distribution.
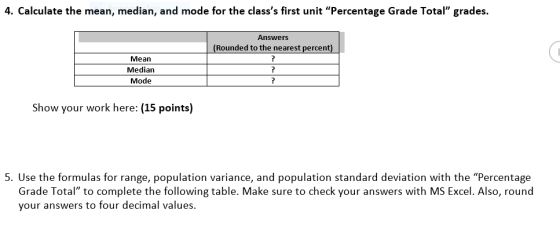
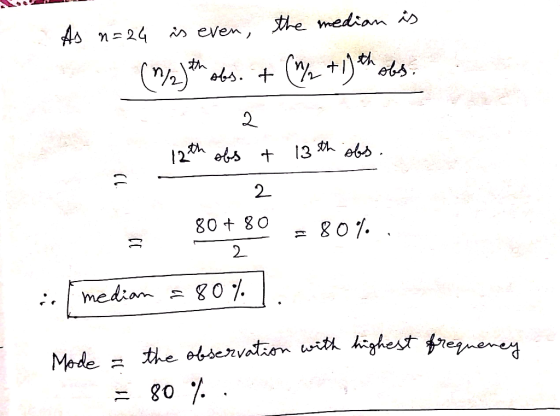
4. Calculate the mean, median, and mode for the class's first unit "Percentage Grade Total" grades. Answers (Rounded to the nearest percent) ? Mean Median Mode Show your work here: (15 points) 5. Use the formulas for range, population variance, and population standard deviation with the "Percentage Grade Total" to complete the following table. Make sure to check your answers with MS Excel. Also, round your answers to four decimal values.
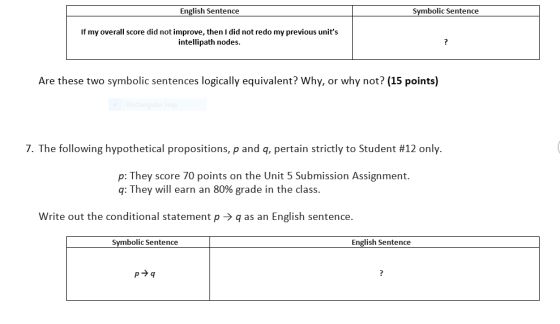
English Sentence Symbolic Sentence my overall score did not improve, then I did not redo my previous unit's intellipath nodes. ? Are these two symbolic sentences logically equivalent? Why, or why not? (15 points) 7. The following hypothetical propositions, p and q, pertain strictly to Student #12 only. p: They q: They will earn an 80% grade in the class score 70 points on the Unit 5 Submission Assignment. Write out the conditional statement p >q as an English sentence. Symbolic Sentence English Sentence ? p q
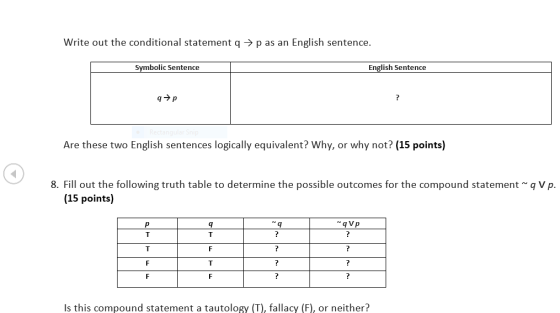
Write out the conditional statement qp as an English sentence. Symbolic Sentence English Sentence qp Are these two English sentences logically equivalent? Why, or why not? (15 points) 8. Fill out the following truth table to determine the possible outcomes for the compound statement ~ qVp. (15 points) qVp q p T ? ? F T ? E Is this compound statement a tautology (T), fallacy (F), or neither?
Homework Answers
Use the formulas for range, population variance, and population standard deviation with the “Percentage Grade Total” to complete the following table. Make sure to check your answers with MS Excel. Also, round your answers to four decimal values
Add Answer to:
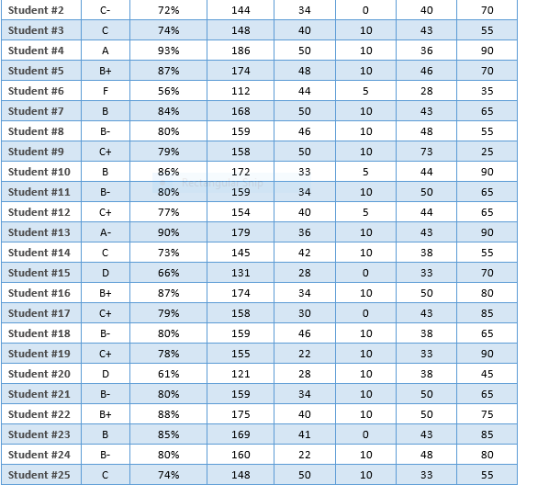
Student #2 C- 72% 144 34 0 40 70 Student #3 74% C 148 40 10 43 55 Student # 4 50 36 A 93% 186 10 90 Student #5 B+ 87% 1...
Logic and Decision Making ALL questions below must be answered. Show ALL step-by-step calculation...
Logic and Decision Making ALL questions below must be answered. Show ALL step-by-step calculations, round all your final answers correctly, and include the units of measurement. Upload this modified Answer Form to the intellipath Unit 6 Submission lesson. Make sure that you submit your work in a modified MS Word document; handwritten work will not be accepted. If you need assistance, please contact your course instructor. A proposed directed study MATH125 class comprising 25 students earned the following grades on...
Determine the number of carbons on the molecule using the mas spectra 43 100 90 80 70 60 50 40 30 39 20 10 74 27 m/z Values and Intensities: 161 38 351 39 21기 40 401 41 6781 42 5781 43 9861 44 45 3...
 Determine the number of carbons on the molecule using the mas
spectra
43 100 90 80 70 60 50 40 30 39 20 10 74 27 m/z Values and Intensities: 161 38 351 39 21기 40 401 41 6781 42 5781 43 9861 44 45 311 46 Trl 50 101 51 이 52 리 53 1기 54 쾨 55 811 56 691 57 601 58 61 59 411 60 T 71 T1 72 Trl 73 74 16275 253 17 54...
Determine the number of carbons on the molecule using the mas
spectra
43 100 90 80 70 60 50 40 30 39 20 10 74 27 m/z Values and Intensities: 161 38 351 39 21기 40 401 41 6781 42 5781 43 9861 44 45 311 46 Trl 50 101 51 이 52 리 53 1기 54 쾨 55 811 56 691 57 601 58 61 59 411 60 T 71 T1 72 Trl 73 74 16275 253 17 54...
Prices Per can Student l Student 2 Student 3 Student 4 $1.00 10 0 5 10...
Prices Per can Student l Student 2 Student 3 Student 4 $1.00 10 0 5 10 .90 10 1 5 11 .80 10 2 5 12 .70 10 4 6 14 .60 10 6 6 16 .50 10 9 7 20 .40 10 13 7 25 .30 10 20 8 33 .20 10 36 9 50 .10 10 80 10 100 A. Graph each student's demand curve for Sierra Mist on separate graphs. Are the demand curves elastic or inelastic?...
'Student Pair' 'Standard Teaching Method' 'New Teaching Method' 1 51 67 2 72 90 3 85...
'Student Pair' 'Standard Teaching Method' 'New Teaching Method' 1 51 67 2 72 90 3 85 82 4 51 63 5 73 76 6 72 73 7 65 78 8 72 94 9 72 85 10 95 100 11 70 80 12 60 72 13 57 100 14 48 58 15 74 89 16 63 97 17 82 88 18 57 45 19 87 81 20 65 99 21 48 69 22 97 70 23 61 47 24 83 73...
QUESTION 1 Figure 2-5 100 90 80 70 60 50 40 30 20 10 10 20...
 QUESTION 1 Figure 2-5 100 90 80 70 60 50 40 30 20 10 10 20 30 40 50 60 70 80 washe Refer to Figure 2-5. It is possible for this economy to produce O a. 60 dryers and 50 washers. b. 60 dryers and 60 washers. c. 80 dryers and 50 washers. O d. All of the above.
1 and 2 1) For the data listed below as the questions (a) to (d). DATA:...
 1 and 2
1) For the data listed below as the questions (a) to (d). DATA: 20 25 40 41 42 43 44 45 46 47 48 49 50 50 51 52 53 54 55 56 57 58 59 60 65 80 90 Questions Points a)Make a frequency diagram with 7 classes b) Make a histogram c) Give the five number summary d) Make a box-and-whisker diagram (show outliers.) 2) At a gathering of 190 college students their grade-group and...
1 and 2
1) For the data listed below as the questions (a) to (d). DATA: 20 25 40 41 42 43 44 45 46 47 48 49 50 50 51 52 53 54 55 56 57 58 59 60 65 80 90 Questions Points a)Make a frequency diagram with 7 classes b) Make a histogram c) Give the five number summary d) Make a box-and-whisker diagram (show outliers.) 2) At a gathering of 190 college students their grade-group and...
89 2 3 5 6 5 6 2 70 4 4 4 2 2 2 9 4 6 4 3 3 6 9 2 9 7 4 9 5 9 5 60 60 98 LA 534 80 50 00 20 00 20 00 60 40 50 90 50 90 80 20 60 40 30 00 90 70 50 80 90 20 90 10 60 50 60 50 60 00 90 10 70 0 1 0 7 9 9...
 89 2 3 5 6 5 6 2 70 4 4 4 2 2 2 9 4 6 4 3 3 6 9 2 9 7 4 9 5 9 5 60 60 98 LA 534 80 50 00 20 00 20 00 60 40 50 90 50 90 80 20 60 40 30 00 90 70 50 80 90 20 90 10 60 50 60 50 60 00 90 10 70 0 1 0 7 9 9 7 .-9....
AI A2 A3 Au AS BI 504-130 20 '0 , เง 50 40 30 10 B' 70to go 70Lo g2 75 85 45 1oo to5 52 65 75 85 15 100 82 80 85 90 95 102 B3 40 42 35 4 5 B3 50 43 42 1 0 A1/% si, leid.on, dy6 in meang&#...
 AI A2 A3 Au AS BI 504-130 20 '0 , เง 50 40 30 10 B' 70to go 70Lo g2 75 85 45 1oo to5 52 65 75 85 15 100 82 80 85 90 95 102 B3 40 42 35 4 5 B3 50 43 42 1 0 A1/% si, leid.on, dy6 in meang' 6 B-6
AI A2 A3 Au AS BI 504-130 20 '0 , เง 50 40 30 10 B' 70to go 70Lo g2 75 85 45...
AI A2 A3 Au AS BI 504-130 20 '0 , เง 50 40 30 10 B' 70to go 70Lo g2 75 85 45 1oo to5 52 65 75 85 15 100 82 80 85 90 95 102 B3 40 42 35 4 5 B3 50 43 42 1 0 A1/% si, leid.on, dy6 in meang' 6 B-6
AI A2 A3 Au AS BI 504-130 20 '0 , เง 50 40 30 10 B' 70to go 70Lo g2 75 85 45...
Student stress at final exam time comes partly from the uncertainty of grades and the consequence...
 Student stress at final exam time comes partly from the
uncertainty of grades and the consequences of those grades. Can
knowledge of a midterm grade be used to predict a final exam grade?
A random sample of 200 BCOM students from recent years was taken
and their percentage grades on assignments, midterm exam, and final
exam were recorded. Let’s examine the ability of midterm and
assignment grades to predict final exam grades.
The data are shown here:
Assignment
Midterm
FinalExam...
Student stress at final exam time comes partly from the
uncertainty of grades and the consequences of those grades. Can
knowledge of a midterm grade be used to predict a final exam grade?
A random sample of 200 BCOM students from recent years was taken
and their percentage grades on assignments, midterm exam, and final
exam were recorded. Let’s examine the ability of midterm and
assignment grades to predict final exam grades.
The data are shown here:
Assignment
Midterm
FinalExam...
Problem 1: Confidence Interval for Percentage of B’s. The data set “STAT 250 Final Exam Scores”...
Problem 1: Confidence Interval for Percentage of B’s. The data set “STAT 250 Final Exam Scores” contains a random sample of 269 STAT 250 students’ final exam scores (maximum of 80) collected over the past two years. Answer the following questions using this data set. a) What proportion of students in our sample earned B’s on the final exam? A letter grade of B is obtained with a score of between 64 and 71 inclusive. Hint: You can do this...
 Determine the number of carbons on the molecule using the mas
spectra
43 100 90 80 70 60 50 40 30 39 20 10 74 27 m/z Values and Intensities: 161 38 351 39 21기 40 401 41 6781 42 5781 43 9861 44 45 311 46 Trl 50 101 51 이 52 리 53 1기 54 쾨 55 811 56 691 57 601 58 61 59 411 60 T 71 T1 72 Trl 73 74 16275 253 17 54...
Determine the number of carbons on the molecule using the mas
spectra
43 100 90 80 70 60 50 40 30 39 20 10 74 27 m/z Values and Intensities: 161 38 351 39 21기 40 401 41 6781 42 5781 43 9861 44 45 311 46 Trl 50 101 51 이 52 리 53 1기 54 쾨 55 811 56 691 57 601 58 61 59 411 60 T 71 T1 72 Trl 73 74 16275 253 17 54...
 QUESTION 1 Figure 2-5 100 90 80 70 60 50 40 30 20 10 10 20 30 40 50 60 70 80 washe Refer to Figure 2-5. It is possible for this economy to produce O a. 60 dryers and 50 washers. b. 60 dryers and 60 washers. c. 80 dryers and 50 washers. O d. All of the above.
 1 and 2
1) For the data listed below as the questions (a) to (d). DATA: 20 25 40 41 42 43 44 45 46 47 48 49 50 50 51 52 53 54 55 56 57 58 59 60 65 80 90 Questions Points a)Make a frequency diagram with 7 classes b) Make a histogram c) Give the five number summary d) Make a box-and-whisker diagram (show outliers.) 2) At a gathering of 190 college students their grade-group and...
1 and 2
1) For the data listed below as the questions (a) to (d). DATA: 20 25 40 41 42 43 44 45 46 47 48 49 50 50 51 52 53 54 55 56 57 58 59 60 65 80 90 Questions Points a)Make a frequency diagram with 7 classes b) Make a histogram c) Give the five number summary d) Make a box-and-whisker diagram (show outliers.) 2) At a gathering of 190 college students their grade-group and...
 89 2 3 5 6 5 6 2 70 4 4 4 2 2 2 9 4 6 4 3 3 6 9 2 9 7 4 9 5 9 5 60 60 98 LA 534 80 50 00 20 00 20 00 60 40 50 90 50 90 80 20 60 40 30 00 90 70 50 80 90 20 90 10 60 50 60 50 60 00 90 10 70 0 1 0 7 9 9 7 .-9....
 AI A2 A3 Au AS BI 504-130 20 '0 , เง 50 40 30 10 B' 70to go 70Lo g2 75 85 45 1oo to5 52 65 75 85 15 100 82 80 85 90 95 102 B3 40 42 35 4 5 B3 50 43 42 1 0 A1/% si, leid.on, dy6 in meang' 6 B-6
AI A2 A3 Au AS BI 504-130 20 '0 , เง 50 40 30 10 B' 70to go 70Lo g2 75 85 45...
AI A2 A3 Au AS BI 504-130 20 '0 , เง 50 40 30 10 B' 70to go 70Lo g2 75 85 45 1oo to5 52 65 75 85 15 100 82 80 85 90 95 102 B3 40 42 35 4 5 B3 50 43 42 1 0 A1/% si, leid.on, dy6 in meang' 6 B-6
AI A2 A3 Au AS BI 504-130 20 '0 , เง 50 40 30 10 B' 70to go 70Lo g2 75 85 45...
 Student stress at final exam time comes partly from the
uncertainty of grades and the consequences of those grades. Can
knowledge of a midterm grade be used to predict a final exam grade?
A random sample of 200 BCOM students from recent years was taken
and their percentage grades on assignments, midterm exam, and final
exam were recorded. Let’s examine the ability of midterm and
assignment grades to predict final exam grades.
The data are shown here:
Assignment
Midterm
FinalExam...
Student stress at final exam time comes partly from the
uncertainty of grades and the consequences of those grades. Can
knowledge of a midterm grade be used to predict a final exam grade?
A random sample of 200 BCOM students from recent years was taken
and their percentage grades on assignments, midterm exam, and final
exam were recorded. Let’s examine the ability of midterm and
assignment grades to predict final exam grades.
The data are shown here:
Assignment
Midterm
FinalExam...
Most questions answered within 3 hours.
-
4. Without doing any calculations, predict whether the observed
∆T would increase, decrease or remain the...
asked 43 minutes ago -
Based on the range, which of the following sets of scores has
the greatest variability? 3,...
asked 1 hour ago -
Ripples in a pond travel at a velocity of 3 m/s with one peak
passing a...
asked 1 hour ago -
A man stands on the roof of a building of height 13.0 mm and
throws a...
asked 1 hour ago -
The extent to which assets are financed by borrowed funds and
other liabilities is indicated by:...
asked 2 hours ago -
Explain in detail
Germany is the fifth largest economy
explain what goods and services Germany specializes...
asked 3 hours ago -
The density of platinum is 21.45 g/mL. If a cube of platinum
with a mass of...
asked 3 hours ago -
Accounts Receivable
Sales
A/R Posting
Extended Sales Invoice
Packing Slip
Compare invoice to packing slip 2...
asked 3 hours ago -
Michaella, age 23, is a full-time law student and is claimed by
her parents as a...
asked 3 hours ago -
Why are polymers not typically casted into products?
asked 3 hours ago -
When rolling a die 129 times, what is the probability of rolling
a 6 no more...
asked 3 hours ago -
4. A call option currently sells for $7.75. It has a strike
price of $85 and...
asked 3 hours ago