
Homework Answers
| CI | Males | Females | prob_males | prob_females |
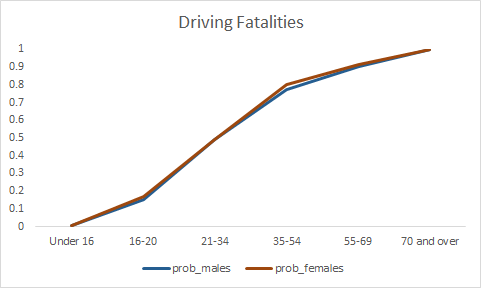
| Under 16 | 258 | 126 | 0.007235 | 0.008584 |
| 16-20 | 5225 | 2366 | 0.146519 | 0.161194 |
| 21-34 | 12016 | 4704 | 0.336951 | 0.32048 |
| 35-54 | 10191 | 4593 | 0.285774 | 0.312917 |
| 55-69 | 4591 | 1631 | 0.12874 | 0.111119 |
| 70 and over | 3380 | 1258 | 0.094781 | 0.085706 |
| Total | 35661 | 14678 | 1 | 1 |

For all,
So, P(males in 55-69) = 4591/33661 = 0.12874 = 0.129 = 0.13
Please rate my answer and comment for doubt.
Add Answer to:
The data represent the number of driving fatalities for a certain area by age for male...
The data represent the number of driving fatalities for a certain area by age for male...
 The data represent the number of driving fatalities for a certain area by age for male and female drivers. Male Female under 16 197 141 16-20 6278 2243 21-34 13.950 4260 35-54 11037 5125 55-69 40812167 70 and over 3400 1641 (a) What is the probability that a randomly selected driver fatality who was male was 16 to 20 years old? The probability that a randomly selected driver fatality who was male was 15 to 20 years old is approximately...
The data represent the number of driving fatalities for a certain area by age for male...
The data represent the number of driving fatalities for a certain area by age for male and female drivers. MaleMale FemaleFemale under 16under 16 167167 127127 16 dash 2016-20 55945594 21572157 21 dash 3421-34 14 comma 61514,615 48214821 35 dash 5435-54 11 comma 26911,269 45754575 55 dash 6955-69 44544454 16791679 70 and over70 and over 29922992 10331033 (a) What is the probability that a randomly selected driver fatality who was malemale was 55 to 6955 to 69 years old?The probability...
The data represent the number of driving fatalities for a certain area by age for male...
The data represent the number of driving fatalities for a certain area by age for male and female drivers. Male Female under 16 114 102 16 dash 20 4198 2139 21 dash 34 14 comma 809 4339 35 dash 54 12 comma 910 5252 55 dash 69 4103 2476 70 and over 2776 1629 (a) What is the probability that a randomly selected driver fatality who was female was 55 to 69 years old?
A Show Work & The data represent the number of driving fatalities for a certain area...
 A Show Work & The data represent the number of driving fatalities for a certain area by age for male and female drivers. Male Female under 16 213 115 16-20 5656 2393 21-34 12 205 4010 35-54 14,170 5035 55-694756 2480 70 and over 2955 1760 (a) What is the probability that a randomly selected driver fatality who was male was 16 to 20 years old? The probability that a randomly selected driver fatality who was male was 16 to...
We The Pound to arundomy weddy who was only way to Swa r owy 2006 maybe...
 We The Pound to arundomy weddy who was only way to Swa r owy 2006 maybe some more to be made by sa A The Other more to che OD. The more you can siano The data represent the number of driving fatalities for a certain area by age for male and female drivers. Male Female under 16 179 129 16-20 5662 2065 21-34 12,676 4647 35-54 13,185 5091 55-69 4502 2485 70 and over 2988 1831 (a) What is...
32.) the data on the right represent the number of live multiple delivery births (3 or...
 32.) the data on the right represent the number of live multiple
delivery births (3 or more babies) in a particular year for women
15 to 54 years old. use data to complete parts a through d
The data on the right represent the number of the multiple delivery birthe (three or more babies) na particular you for women 16 to 5 years old. Use the date to complete parts (4) through (4) below Number of Multiple Birth Age 15-19...
32.) the data on the right represent the number of live multiple
delivery births (3 or more babies) in a particular year for women
15 to 54 years old. use data to complete parts a through d
The data on the right represent the number of the multiple delivery birthe (three or more babies) na particular you for women 16 to 5 years old. Use the date to complete parts (4) through (4) below Number of Multiple Birth Age 15-19...
 The data represent the number of driving fatalities for a certain area by age for male and female drivers. Male Female under 16 197 141 16-20 6278 2243 21-34 13.950 4260 35-54 11037 5125 55-69 40812167 70 and over 3400 1641 (a) What is the probability that a randomly selected driver fatality who was male was 16 to 20 years old? The probability that a randomly selected driver fatality who was male was 15 to 20 years old is approximately...
 A Show Work & The data represent the number of driving fatalities for a certain area by age for male and female drivers. Male Female under 16 213 115 16-20 5656 2393 21-34 12 205 4010 35-54 14,170 5035 55-694756 2480 70 and over 2955 1760 (a) What is the probability that a randomly selected driver fatality who was male was 16 to 20 years old? The probability that a randomly selected driver fatality who was male was 16 to...
 We The Pound to arundomy weddy who was only way to Swa r owy 2006 maybe some more to be made by sa A The Other more to che OD. The more you can siano The data represent the number of driving fatalities for a certain area by age for male and female drivers. Male Female under 16 179 129 16-20 5662 2065 21-34 12,676 4647 35-54 13,185 5091 55-69 4502 2485 70 and over 2988 1831 (a) What is...
 32.) the data on the right represent the number of live multiple
delivery births (3 or more babies) in a particular year for women
15 to 54 years old. use data to complete parts a through d
The data on the right represent the number of the multiple delivery birthe (three or more babies) na particular you for women 16 to 5 years old. Use the date to complete parts (4) through (4) below Number of Multiple Birth Age 15-19...
32.) the data on the right represent the number of live multiple
delivery births (3 or more babies) in a particular year for women
15 to 54 years old. use data to complete parts a through d
The data on the right represent the number of the multiple delivery birthe (three or more babies) na particular you for women 16 to 5 years old. Use the date to complete parts (4) through (4) below Number of Multiple Birth Age 15-19...
Most questions answered within 3 hours.
-
Write a program to score the paper-rock-scissor game. Each of
two users types in either P,R...
asked 18 minutes ago -
Calculate the equillibrium constent K for a redox reaction that
has E°cell = -.98 V at...
asked 30 minutes ago -
A concave spherical mirror has a radius of curvature of
magnitude 19.6 cm.
(a) Find the...
asked 32 minutes ago -
3. draw a diagram of the magnetic field:
a. around a long straight wire with a...
asked 30 minutes ago -
If you titrated 30.0 mL of 0.1 M HCl with 0.1 M NaOH, indicate
the approximate...
asked 39 minutes ago -
NADH passes electrons into the electron transport chain. List
the carriers that would receive the electrons,...
asked 47 minutes ago -
A cylindrical cable with a resistivity of 1.6x10⁻⁸ Ω·m and cross
sectional area of 3x10⁻⁵ m^2...
asked 47 minutes ago -
True or False.
A consumer with convex preferences who is indifferent between
the bundles (5,2) and...
asked 51 minutes ago -
A diamond's index of refraction for red light, 656 nm, is 2.410,
while that for blue...
asked 1 hour ago -
Compare HPLC, SPE, and GC. Identify the differences, the
advantages, and the weaknesses of each method.
asked 1 hour ago -
Characteristic x-rays emitted by potassium have a wavelength of
0.374 nm. What is the energy of...
asked 1 hour ago -
there is a function to create two random numbers between 1 and
25 and a function...
asked 1 hour ago