
Homework Answers
For this question, we need to first find the total number of people in the data as show below
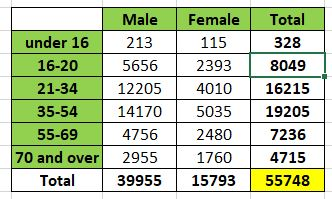
We find the total column wise and row wise as shown below.
a. The probability that a randomly selected driver who was
male was 16 to 20 years old
P(16 to 20 | male) = n( driver who are male and 16 to 20 years old)/n(male drivers) = 5656/39955 = 0.1415593
explanation : We need to find the probability of a driver who is 16 to 20 years old given that is a male. Hence we need to use conditional probability as shown above.
b. The probability that a randomly select driver who was 16 to 20 was male
P( male|16 to 20 ) = n( driver who are male and 16 to 20 years old)/n(16 to 20 drivers) = 5656/8049 = 0.702696
explanation : We need to find the probability of a driver who is a male given that he is 16 to 20 years old . Hence we need to use conditional probability as shown above.
Add Answer to:
A Show Work & The data represent the number of driving fatalities for a certain area...
The data represent the number of driving fatalities for a certain area by age for male...
 The data represent the number of driving fatalities for a certain area by age for male and female drivers. Male Female under 16 197 141 16-20 6278 2243 21-34 13.950 4260 35-54 11037 5125 55-69 40812167 70 and over 3400 1641 (a) What is the probability that a randomly selected driver fatality who was male was 16 to 20 years old? The probability that a randomly selected driver fatality who was male was 15 to 20 years old is approximately...
The data represent the number of driving fatalities for a certain area by age for male...
 The data represent the number of driving fatalities for a certain area by age for male and female drivers. Male Female under 16 258 126 16-20 5225 2366 21-34 12,016 4704 35.54 10,191 4593 55.69 4591 1631 70 and over 3380 1258 (a) What is the probability that a randomly selected driver fatality who was male was 55 to 69 years old? The probability that a randomly selected driver fatality who was male was 55 to 69 years old is...
The data represent the number of driving fatalities for a certain area by age for male...
The data represent the number of driving fatalities for a certain area by age for male and female drivers. MaleMale FemaleFemale under 16under 16 167167 127127 16 dash 2016-20 55945594 21572157 21 dash 3421-34 14 comma 61514,615 48214821 35 dash 5435-54 11 comma 26911,269 45754575 55 dash 6955-69 44544454 16791679 70 and over70 and over 29922992 10331033 (a) What is the probability that a randomly selected driver fatality who was malemale was 55 to 6955 to 69 years old?The probability...
The data represent the number of driving fatalities for a certain area by age for male...
The data represent the number of driving fatalities for a certain area by age for male and female drivers. Male Female under 16 114 102 16 dash 20 4198 2139 21 dash 34 14 comma 809 4339 35 dash 54 12 comma 910 5252 55 dash 69 4103 2476 70 and over 2776 1629 (a) What is the probability that a randomly selected driver fatality who was female was 55 to 69 years old?
We The Pound to arundomy weddy who was only way to Swa r owy 2006 maybe...
 We The Pound to arundomy weddy who was only way to Swa r owy 2006 maybe some more to be made by sa A The Other more to che OD. The more you can siano The data represent the number of driving fatalities for a certain area by age for male and female drivers. Male Female under 16 179 129 16-20 5662 2065 21-34 12,676 4647 35-54 13,185 5091 55-69 4502 2485 70 and over 2988 1831 (a) What is...
The probability thart a randomly selected driver fartality who was female was greatr than 70 years...
 The probability thart a randomly selected driver fartality who was female was greatr than 70 years old is approximately Round to three decimal places as needed) O C. The driver is more lkaly to be male because the probability is greater than 0.5 O D. The driver is more ikely to be female because the probability is greater than 05
The data on the right represent the number of the muliple-delivery birth (three or more habe...
 The data on the right represent the number of the muliple-delivery birth (three or more habe in particule year for women 15 to 5 years old. Use the date to complete parte a through the below Nawrot to Age 97 35 TA 155 la) Determine the probably thw a randomly selected multiple for women 15-54 years old involved a mother 30 to 39 years old PC3039-0 Type an integer or decimal rounded to the decimal places as needed (b) Determine...
32.) the data on the right represent the number of live multiple delivery births (3 or...
 32.) the data on the right represent the number of live multiple
delivery births (3 or more babies) in a particular year for women
15 to 54 years old. use data to complete parts a through d
The data on the right represent the number of the multiple delivery birthe (three or more babies) na particular you for women 16 to 5 years old. Use the date to complete parts (4) through (4) below Number of Multiple Birth Age 15-19...
32.) the data on the right represent the number of live multiple
delivery births (3 or more babies) in a particular year for women
15 to 54 years old. use data to complete parts a through d
The data on the right represent the number of the multiple delivery birthe (three or more babies) na particular you for women 16 to 5 years old. Use the date to complete parts (4) through (4) below Number of Multiple Birth Age 15-19...
Suppose the data to the right represent the survival data for the a certain ship that...
 Suppose the data to the right represent the survival data for the a certain ship that sank. The males are adult males and the females are adult females. Complete parts (a) through (j). Survived Died Total Male 206 1,386 1,592 Female Child 354 54 87 54 441 108 Total 614 1,527 2,141 (Round to three decimal places as needed.) (e) If a passenger is selected at random, what is the probability that the passenger was female or survived? (Round to...
Data is taken on 773 randomly selected adults who are at least 20 years old. The...
Data is taken on 773 randomly selected adults who are at least 20 years old. The data is broken down according to sex and age. Suppose one person is randomly selected. Find the following empirical probabilities. Round your answers to three decimal places. (a) Find the probability that they are male. (b) Find the probability that they are between 30 and 39 years old. (c) Find the probability that they are between 30 and 39 or they are older than...
 The data represent the number of driving fatalities for a certain area by age for male and female drivers. Male Female under 16 197 141 16-20 6278 2243 21-34 13.950 4260 35-54 11037 5125 55-69 40812167 70 and over 3400 1641 (a) What is the probability that a randomly selected driver fatality who was male was 16 to 20 years old? The probability that a randomly selected driver fatality who was male was 15 to 20 years old is approximately...
 The data represent the number of driving fatalities for a certain area by age for male and female drivers. Male Female under 16 258 126 16-20 5225 2366 21-34 12,016 4704 35.54 10,191 4593 55.69 4591 1631 70 and over 3380 1258 (a) What is the probability that a randomly selected driver fatality who was male was 55 to 69 years old? The probability that a randomly selected driver fatality who was male was 55 to 69 years old is...
 We The Pound to arundomy weddy who was only way to Swa r owy 2006 maybe some more to be made by sa A The Other more to che OD. The more you can siano The data represent the number of driving fatalities for a certain area by age for male and female drivers. Male Female under 16 179 129 16-20 5662 2065 21-34 12,676 4647 35-54 13,185 5091 55-69 4502 2485 70 and over 2988 1831 (a) What is...
 The probability thart a randomly selected driver fartality who was female was greatr than 70 years old is approximately Round to three decimal places as needed) O C. The driver is more lkaly to be male because the probability is greater than 0.5 O D. The driver is more ikely to be female because the probability is greater than 05
 The data on the right represent the number of the muliple-delivery birth (three or more habe in particule year for women 15 to 5 years old. Use the date to complete parte a through the below Nawrot to Age 97 35 TA 155 la) Determine the probably thw a randomly selected multiple for women 15-54 years old involved a mother 30 to 39 years old PC3039-0 Type an integer or decimal rounded to the decimal places as needed (b) Determine...
 32.) the data on the right represent the number of live multiple
delivery births (3 or more babies) in a particular year for women
15 to 54 years old. use data to complete parts a through d
The data on the right represent the number of the multiple delivery birthe (three or more babies) na particular you for women 16 to 5 years old. Use the date to complete parts (4) through (4) below Number of Multiple Birth Age 15-19...
32.) the data on the right represent the number of live multiple
delivery births (3 or more babies) in a particular year for women
15 to 54 years old. use data to complete parts a through d
The data on the right represent the number of the multiple delivery birthe (three or more babies) na particular you for women 16 to 5 years old. Use the date to complete parts (4) through (4) below Number of Multiple Birth Age 15-19...
 Suppose the data to the right represent the survival data for the a certain ship that sank. The males are adult males and the females are adult females. Complete parts (a) through (j). Survived Died Total Male 206 1,386 1,592 Female Child 354 54 87 54 441 108 Total 614 1,527 2,141 (Round to three decimal places as needed.) (e) If a passenger is selected at random, what is the probability that the passenger was female or survived? (Round to...
Most questions answered within 3 hours.
-
Blood pressure is normally taken on the upper arm at the level
of the heart. Suppose,...
asked 3 minutes ago -
trust is best established through the combination of ------and
------- .
1. magnanimity and justice
2....
asked 4 minutes ago -
Calculate the [OH (aq)] in limes which have a [H3O*(aq)] of 1.3 x
10 mol/L
asked 4 minutes ago -
Suppose that the satellite around the earth has an orbit that is
24 KM larger in...
asked 6 minutes ago -
A nozzle with a radius of 0.250 cm is attached to a garden hose
with a...
asked 15 minutes ago -
PLEASE do not use any loops for the program; only recursion is
allowed
4. Write a...
asked 24 minutes ago -
Please help me with me. I did the first part to write the operations but in...
asked 21 minutes ago -
Use Cryptool to find the Cryptographic SHA-1 hash value of the
string "abc". The calculator is...
asked 25 minutes ago -
You are attempting to calculate a firm’s free cash flow to
equity. You know the following...
asked 1 hour ago -
the following reaction occurs in a balloon containing
N2O2 gas
N2O4(g)=2NO2(g)
will the volume of the...
asked 1 hour ago -
answer the questions throughout this program
public class Day implements Comparable {
Private Boolean atWork;...
asked 1 hour ago -
This is C++ code for parking fee management program
#include <iostream>
#include <iomanip>
using namespace std;...
asked 2 hours ago