

Homework Answers
Add Answer to:
The data represent the number of driving fatalities for a certain area by age for male...
The data represent the number of driving fatalities for a certain area by age for male...
 The data represent the number of driving fatalities for a certain area by age for male and female drivers. Male Female under 16 258 126 16-20 5225 2366 21-34 12,016 4704 35.54 10,191 4593 55.69 4591 1631 70 and over 3380 1258 (a) What is the probability that a randomly selected driver fatality who was male was 55 to 69 years old? The probability that a randomly selected driver fatality who was male was 55 to 69 years old is...
A Show Work & The data represent the number of driving fatalities for a certain area...
 A Show Work & The data represent the number of driving fatalities for a certain area by age for male and female drivers. Male Female under 16 213 115 16-20 5656 2393 21-34 12 205 4010 35-54 14,170 5035 55-694756 2480 70 and over 2955 1760 (a) What is the probability that a randomly selected driver fatality who was male was 16 to 20 years old? The probability that a randomly selected driver fatality who was male was 16 to...
The data represent the number of driving fatalities for a certain area by age for male...
The data represent the number of driving fatalities for a certain area by age for male and female drivers. MaleMale FemaleFemale under 16under 16 167167 127127 16 dash 2016-20 55945594 21572157 21 dash 3421-34 14 comma 61514,615 48214821 35 dash 5435-54 11 comma 26911,269 45754575 55 dash 6955-69 44544454 16791679 70 and over70 and over 29922992 10331033 (a) What is the probability that a randomly selected driver fatality who was malemale was 55 to 6955 to 69 years old?The probability...
The data represent the number of driving fatalities for a certain area by age for male...
The data represent the number of driving fatalities for a certain area by age for male and female drivers. Male Female under 16 114 102 16 dash 20 4198 2139 21 dash 34 14 comma 809 4339 35 dash 54 12 comma 910 5252 55 dash 69 4103 2476 70 and over 2776 1629 (a) What is the probability that a randomly selected driver fatality who was female was 55 to 69 years old?
We The Pound to arundomy weddy who was only way to Swa r owy 2006 maybe...
 We The Pound to arundomy weddy who was only way to Swa r owy 2006 maybe some more to be made by sa A The Other more to che OD. The more you can siano The data represent the number of driving fatalities for a certain area by age for male and female drivers. Male Female under 16 179 129 16-20 5662 2065 21-34 12,676 4647 35-54 13,185 5091 55-69 4502 2485 70 and over 2988 1831 (a) What is...
The probability thart a randomly selected driver fartality who was female was greatr than 70 years...
 The probability thart a randomly selected driver fartality who was female was greatr than 70 years old is approximately Round to three decimal places as needed) O C. The driver is more lkaly to be male because the probability is greater than 0.5 O D. The driver is more ikely to be female because the probability is greater than 05
The data in the table represent the number of licensed drivers in various age groups and...
 The data in the table represent the number of licensed drivers in various age groups and the number of fatal accidents within the age group by gender. Complete parts (a) through (c) below. Click the icon to view the data table (a) Find the least-squares regression line for males treating the number of licensed drivers as the explanatory variable, x, and the number of fatal crashes, y, as the response variable. Repeat this procedure for females Press Continue to see...
32.) the data on the right represent the number of live multiple delivery births (3 or...
 32.) the data on the right represent the number of live multiple
delivery births (3 or more babies) in a particular year for women
15 to 54 years old. use data to complete parts a through d
The data on the right represent the number of the multiple delivery birthe (three or more babies) na particular you for women 16 to 5 years old. Use the date to complete parts (4) through (4) below Number of Multiple Birth Age 15-19...
32.) the data on the right represent the number of live multiple
delivery births (3 or more babies) in a particular year for women
15 to 54 years old. use data to complete parts a through d
The data on the right represent the number of the multiple delivery birthe (three or more babies) na particular you for women 16 to 5 years old. Use the date to complete parts (4) through (4) below Number of Multiple Birth Age 15-19...
The table below shows the number of male and female students enrolled in nursing at a university for a certain semester A student is parts (a) through (d) selected at random. Complete Tota...
 The table below shows the number of male and female students enrolled in nursing at a university for a certain semester A student is parts (a) through (d) selected at random. Complete Total 1108 2321 3429 Nursing majors Non-nursing majors 1013 1721 2734 Males Females Total 95 600 696 (a) Find the probability that the student is male or a nursing major. P(being male or being nursing major) Round to the nearest thousandth as needed) b) Find the probability that...
The data on the right represent the number of the muliple-delivery birth (three or more habe...
 The data on the right represent the number of the muliple-delivery birth (three or more habe in particule year for women 15 to 5 years old. Use the date to complete parte a through the below Nawrot to Age 97 35 TA 155 la) Determine the probably thw a randomly selected multiple for women 15-54 years old involved a mother 30 to 39 years old PC3039-0 Type an integer or decimal rounded to the decimal places as needed (b) Determine...
 The data represent the number of driving fatalities for a certain area by age for male and female drivers. Male Female under 16 258 126 16-20 5225 2366 21-34 12,016 4704 35.54 10,191 4593 55.69 4591 1631 70 and over 3380 1258 (a) What is the probability that a randomly selected driver fatality who was male was 55 to 69 years old? The probability that a randomly selected driver fatality who was male was 55 to 69 years old is...
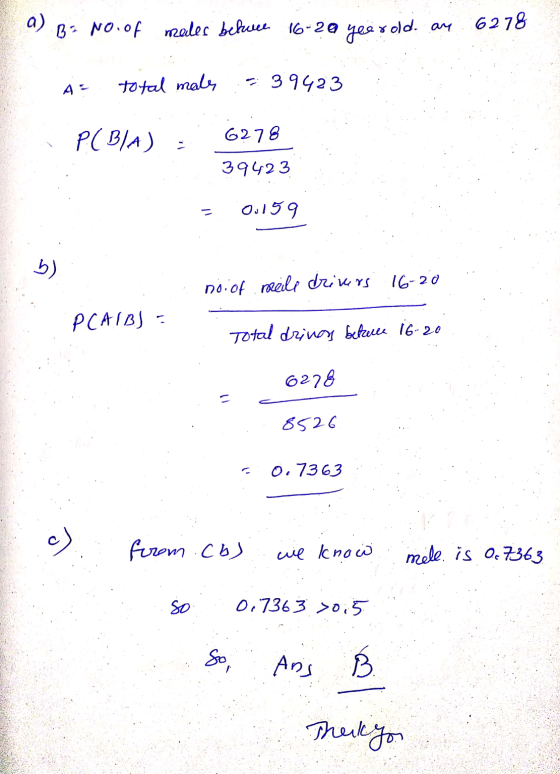
 A Show Work & The data represent the number of driving fatalities for a certain area by age for male and female drivers. Male Female under 16 213 115 16-20 5656 2393 21-34 12 205 4010 35-54 14,170 5035 55-694756 2480 70 and over 2955 1760 (a) What is the probability that a randomly selected driver fatality who was male was 16 to 20 years old? The probability that a randomly selected driver fatality who was male was 16 to...
 We The Pound to arundomy weddy who was only way to Swa r owy 2006 maybe some more to be made by sa A The Other more to che OD. The more you can siano The data represent the number of driving fatalities for a certain area by age for male and female drivers. Male Female under 16 179 129 16-20 5662 2065 21-34 12,676 4647 35-54 13,185 5091 55-69 4502 2485 70 and over 2988 1831 (a) What is...
 The probability thart a randomly selected driver fartality who was female was greatr than 70 years old is approximately Round to three decimal places as needed) O C. The driver is more lkaly to be male because the probability is greater than 0.5 O D. The driver is more ikely to be female because the probability is greater than 05
 The data in the table represent the number of licensed drivers in various age groups and the number of fatal accidents within the age group by gender. Complete parts (a) through (c) below. Click the icon to view the data table (a) Find the least-squares regression line for males treating the number of licensed drivers as the explanatory variable, x, and the number of fatal crashes, y, as the response variable. Repeat this procedure for females Press Continue to see...
 32.) the data on the right represent the number of live multiple
delivery births (3 or more babies) in a particular year for women
15 to 54 years old. use data to complete parts a through d
The data on the right represent the number of the multiple delivery birthe (three or more babies) na particular you for women 16 to 5 years old. Use the date to complete parts (4) through (4) below Number of Multiple Birth Age 15-19...
32.) the data on the right represent the number of live multiple
delivery births (3 or more babies) in a particular year for women
15 to 54 years old. use data to complete parts a through d
The data on the right represent the number of the multiple delivery birthe (three or more babies) na particular you for women 16 to 5 years old. Use the date to complete parts (4) through (4) below Number of Multiple Birth Age 15-19...
 The table below shows the number of male and female students enrolled in nursing at a university for a certain semester A student is parts (a) through (d) selected at random. Complete Total 1108 2321 3429 Nursing majors Non-nursing majors 1013 1721 2734 Males Females Total 95 600 696 (a) Find the probability that the student is male or a nursing major. P(being male or being nursing major) Round to the nearest thousandth as needed) b) Find the probability that...
 The data on the right represent the number of the muliple-delivery birth (three or more habe in particule year for women 15 to 5 years old. Use the date to complete parte a through the below Nawrot to Age 97 35 TA 155 la) Determine the probably thw a randomly selected multiple for women 15-54 years old involved a mother 30 to 39 years old PC3039-0 Type an integer or decimal rounded to the decimal places as needed (b) Determine...
Most questions answered within 3 hours.
-
If you titrated 30.0 mL of 0.1 M HCl with 0.1 M NaOH, indicate
the approximate...
asked 5 minutes ago -
NADH passes electrons into the electron transport chain. List
the carriers that would receive the electrons,...
asked 13 minutes ago -
A cylindrical cable with a resistivity of 1.6x10⁻⁸ Ω·m and cross
sectional area of 3x10⁻⁵ m^2...
asked 13 minutes ago -
True or False.
A consumer with convex preferences who is indifferent between
the bundles (5,2) and...
asked 17 minutes ago -
A diamond's index of refraction for red light, 656 nm, is 2.410,
while that for blue...
asked 30 minutes ago -
Compare HPLC, SPE, and GC. Identify the differences, the
advantages, and the weaknesses of each method.
asked 31 minutes ago -
Characteristic x-rays emitted by potassium have a wavelength of
0.374 nm. What is the energy of...
asked 33 minutes ago -
there is a function to create two random numbers between 1 and
25 and a function...
asked 51 minutes ago -
At a certain temperature, the ?pKp for the decomposition of
H2SH2S is 0.832.0.832.
H2S(g)↽−−⇀H2(g)+S(g)H2S(g)↽−−⇀H2(g)+S(g)
Initially, only...
asked 45 minutes ago -
Part 1.C&A Fast Food has four activities in serving a
customer: greet customer, take order, process...
asked 51 minutes ago -
Which attribute allows you to specify a custom "thumbnail" for
multimedia elements?
asked 1 hour ago -
How much 0.1200 M sodium hydroxide solution is need to titrate
14 mL of a 0.100...
asked 1 hour ago