


find
current ratio
EBIT
EPS
Turnover inventory and received
debt equity
profit margins
Homework Answers

Add Answer to:
find
current ratio
EBIT
EPS
Turnover inventory and received
debt equity
profit margins
Table of Contents...
I am working on doing an analysis of a company for my accounting class. can you...
 I am working on doing an analysis of a company for my accounting
class. can you please review what I have and correct what I have
wrong. Also, Help me with the ones I have left blank as I can not
find the right information to solve these. Thank you so much!!
Ratio:
Formula:
Year:
Formula:
Total:
Current Ratio:
Current Assets / Current Liabilities
2018
566,951 / 379,743
1.49
Acid-Test Ratio
Cash + Short- Term Investments + Current Receivables /...
I am working on doing an analysis of a company for my accounting
class. can you please review what I have and correct what I have
wrong. Also, Help me with the ones I have left blank as I can not
find the right information to solve these. Thank you so much!!
Ratio:
Formula:
Year:
Formula:
Total:
Current Ratio:
Current Assets / Current Liabilities
2018
566,951 / 379,743
1.49
Acid-Test Ratio
Cash + Short- Term Investments + Current Receivables /...
calculate the following financial indicators Current Ratio Debt/Equity Ratio Free Cash Flow Earnings...
 calculate the following financial
indicators
Current Ratio
Debt/Equity Ratio
Free Cash Flow
Earnings per Share
Price/Earnings Ratio
Return on Equity
Net Profit Margin
As Reported Annual Income Statement Report Date Currency Audit Status Consolidated Scale Net product sales Net services sales Total net sales Cost of sales Fulfillment expenses Marketing expenses Technology & content expenses General & administrative expenses Other operating expense (income), net Total operating expenses & costs Income from operations Interest income Interest expense...
calculate the following financial
indicators
Current Ratio
Debt/Equity Ratio
Free Cash Flow
Earnings per Share
Price/Earnings Ratio
Return on Equity
Net Profit Margin
As Reported Annual Income Statement Report Date Currency Audit Status Consolidated Scale Net product sales Net services sales Total net sales Cost of sales Fulfillment expenses Marketing expenses Technology & content expenses General & administrative expenses Other operating expense (income), net Total operating expenses & costs Income from operations Interest income Interest expense...
Describe/ Explain the financial numbers in the attached Coca Cola report such as EPS, EBIT,assets, liabilities,...
 Describe/ Explain the financial numbers in the attached Coca Cola
report such as EPS, EBIT,assets, liabilities, and other financial
numbers. (For example explain if the company is doing good or bad
based on the number from previous year 2016-2015). explain how the
financial numbers are used in the strategic planning process as
related to the products sold and markets the sell into?
THE COCA-COLA COMPANY AND SUBSIDIARIES CONSOLIDATED STATEMENTS OF INCOME 2016 2015 2014 (In millions except per share data)...
Describe/ Explain the financial numbers in the attached Coca Cola
report such as EPS, EBIT,assets, liabilities, and other financial
numbers. (For example explain if the company is doing good or bad
based on the number from previous year 2016-2015). explain how the
financial numbers are used in the strategic planning process as
related to the products sold and markets the sell into?
THE COCA-COLA COMPANY AND SUBSIDIARIES CONSOLIDATED STATEMENTS OF INCOME 2016 2015 2014 (In millions except per share data)...
Find ratio analysis for liquidity and efficiency COSTCO WHOLESALE CORPORATION CONSOLIDATED BALANCE SHEETS (amounts in millions,...
 Find ratio analysis for liquidity and efficiency COSTCO WHOLESALE CORPORATION CONSOLIDATED BALANCE SHEETS (amounts in millions, except par value and share data) September 3, 2017 August 28, 2016 $ 4,546 1,233 1,432 9,834 1,350 1,252 8,969 ASSETS CURRENT ASSETS Cash and cash equivalents ........... Short-term investments ............. Receivables, net ............ Merchandise inventories ...... Other current assets... Total current assets PROPERTY AND EQUIPMENT Land .. Buildings and improvements... Equipment and fixtures Construction in progress... 272 268 17,317 15.218 5,690 15,127 6,681...
Calculate the company's debt to total assets ratio (also called total debt ratio) for both the...
 Calculate the company's debt to total assets ratio (also called total debt ratio) for both the recent year and the prior year. Show your computations. Write the textbook formula here: Recent year: Prior year: Explain what information this ratio provides (define), and what the results mean to this company. Use complete sentences and your own words. Compare the two, has the ratio improved? The Procter& Gamble Company 37 Consolidated Statements of Earnings 2018 2017 2016 NET SALES S 66,832 S...
Current ratio Quick ratio Debt to equity ratio Times interest earned ratio Receivables turnover rati...
 Current ratio
Quick ratio
Debt to equity ratio
Times interest earned ratio
Receivables turnover ratio
Average collection period
Inventory turnover ratio
Average days inventory held
Payables turnover ratio
Average days payables outstanding
Asset turnover ratio
Profit margin on sales
Return on assets (ROA)
Return on shareholders' equity (ROE)
To calculate the above statement using the following
material:
FORD MOTOR COMPANY AND SUBSIDIARIES CONSOLIDATED BALANCE SHEET (in millions) December 31 2018 December 31 2017 ASSETS Cash and cash equivalents (Note 9)...
Current ratio
Quick ratio
Debt to equity ratio
Times interest earned ratio
Receivables turnover ratio
Average collection period
Inventory turnover ratio
Average days inventory held
Payables turnover ratio
Average days payables outstanding
Asset turnover ratio
Profit margin on sales
Return on assets (ROA)
Return on shareholders' equity (ROE)
To calculate the above statement using the following
material:
FORD MOTOR COMPANY AND SUBSIDIARIES CONSOLIDATED BALANCE SHEET (in millions) December 31 2018 December 31 2017 ASSETS Cash and cash equivalents (Note 9)...
calculate ROA ROE gross profit margin quick ratio debt to equity ratio inventory turnover calculate 2018...
 calculate
ROA
ROE
gross profit margin
quick ratio
debt to equity ratio
inventory turnover
calculate 2018 and 2019
1. ROA 2.DE 3. Groos profit 4. Quick ratio. 5. Debt to equity ratio: 6. Inventory turnover. nogin Eligibler Net Income = Total Revene- Total Expense. Total Assets = Liabilities + Owner's Equity Gross protit margin = (sales - rest of guels sodel/sales. 1. ROA 2. ROE 4. Quick ratio. 5. Debt to equity ratio. 6. Inventay turnover. 3. Gross protit Margin...
calculate
ROA
ROE
gross profit margin
quick ratio
debt to equity ratio
inventory turnover
calculate 2018 and 2019
1. ROA 2.DE 3. Groos profit 4. Quick ratio. 5. Debt to equity ratio: 6. Inventory turnover. nogin Eligibler Net Income = Total Revene- Total Expense. Total Assets = Liabilities + Owner's Equity Gross protit margin = (sales - rest of guels sodel/sales. 1. ROA 2. ROE 4. Quick ratio. 5. Debt to equity ratio. 6. Inventay turnover. 3. Gross protit Margin...
Questions: What was the $value of gross trade receivables for 2019 and 2018? What was the...
 Questions: What was the $value of gross trade receivables for
2019 and 2018?
What was the receivables turnover for 2019?
Compute the changes in cash, cash equivalents and receivables
from 2018 to 2019.
Please indicate the sheet the answer same from than you so
much.
THE COCA-COLA COMPANY AND SUBSIDIARIES CONSOLIDATED STATEMENTS OF INCOME (In millions except per share data) 2019 2018 2017 S 37,266 14,619 22,647 12,103 34,300 $ 13,067 21,233 11,002 1,079 9,152 689 950 36,212 13,721 22,491...
Questions: What was the $value of gross trade receivables for
2019 and 2018?
What was the receivables turnover for 2019?
Compute the changes in cash, cash equivalents and receivables
from 2018 to 2019.
Please indicate the sheet the answer same from than you so
much.
THE COCA-COLA COMPANY AND SUBSIDIARIES CONSOLIDATED STATEMENTS OF INCOME (In millions except per share data) 2019 2018 2017 S 37,266 14,619 22,647 12,103 34,300 $ 13,067 21,233 11,002 1,079 9,152 689 950 36,212 13,721 22,491...
Were the dividends on common stock and/or preferred stock? What was the amount of each? Did...
 Were the dividends on common stock and/or preferred stock? What
was the amount of each?
Did Retained Earnings change for any reasons other than net
income or dividends? Explain.
What classes of stock does your company have?
How many shares of each class of stock are authorized, how many
are issued, and how many are outstanding?
Does your company have any treasury stock? How many shares and
what dollar amount?
What is the par or stated value of each of...
Were the dividends on common stock and/or preferred stock? What
was the amount of each?
Did Retained Earnings change for any reasons other than net
income or dividends? Explain.
What classes of stock does your company have?
How many shares of each class of stock are authorized, how many
are issued, and how many are outstanding?
Does your company have any treasury stock? How many shares and
what dollar amount?
What is the par or stated value of each of...
COSTCO WHOLESALE CORPORATION CONSOLIDATED BALANCE SHEETS (amounts in millions, except par value and share data) September...
 COSTCO WHOLESALE CORPORATION CONSOLIDATED BALANCE SHEETS (amounts in millions, except par value and share data) September 2, September 3, 2017 2018 $ ASSETS CURRENT ASSETS Cash and cash equivalents .... Short-term investments .... Receivables, net. Merchandise inventories ..... Other current assets ...... Total current assets .... PROPERTY AND EQUIPMENT 6.055 1,204 1,669 11.040 321 20.289 4,546 1,233 1.432 9.834 272 17,317 Land Buildings and improvements. Equipment and futures Construction in progress 6,193 16.107 7.274 1.140 30.714 (11.033) 19,681 5,690 15,127...
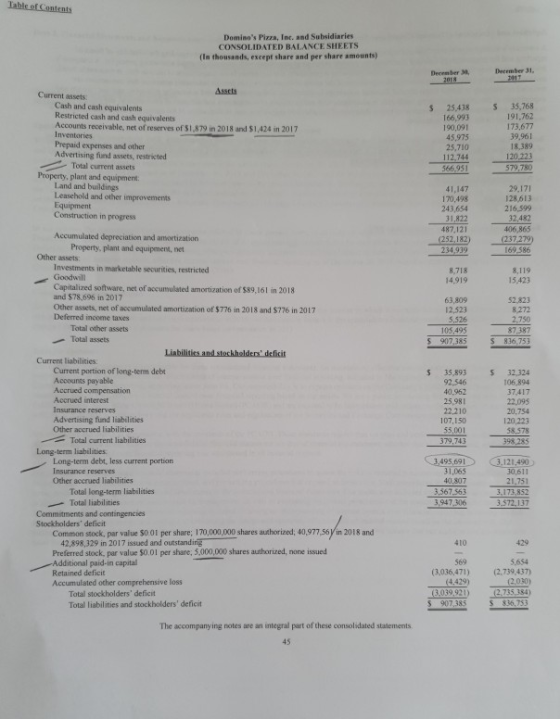
 I am working on doing an analysis of a company for my accounting
class. can you please review what I have and correct what I have
wrong. Also, Help me with the ones I have left blank as I can not
find the right information to solve these. Thank you so much!!
Ratio:
Formula:
Year:
Formula:
Total:
Current Ratio:
Current Assets / Current Liabilities
2018
566,951 / 379,743
1.49
Acid-Test Ratio
Cash + Short- Term Investments + Current Receivables /...
I am working on doing an analysis of a company for my accounting
class. can you please review what I have and correct what I have
wrong. Also, Help me with the ones I have left blank as I can not
find the right information to solve these. Thank you so much!!
Ratio:
Formula:
Year:
Formula:
Total:
Current Ratio:
Current Assets / Current Liabilities
2018
566,951 / 379,743
1.49
Acid-Test Ratio
Cash + Short- Term Investments + Current Receivables /...
 calculate the following financial
indicators
Current Ratio
Debt/Equity Ratio
Free Cash Flow
Earnings per Share
Price/Earnings Ratio
Return on Equity
Net Profit Margin
As Reported Annual Income Statement Report Date Currency Audit Status Consolidated Scale Net product sales Net services sales Total net sales Cost of sales Fulfillment expenses Marketing expenses Technology & content expenses General & administrative expenses Other operating expense (income), net Total operating expenses & costs Income from operations Interest income Interest expense...
calculate the following financial
indicators
Current Ratio
Debt/Equity Ratio
Free Cash Flow
Earnings per Share
Price/Earnings Ratio
Return on Equity
Net Profit Margin
As Reported Annual Income Statement Report Date Currency Audit Status Consolidated Scale Net product sales Net services sales Total net sales Cost of sales Fulfillment expenses Marketing expenses Technology & content expenses General & administrative expenses Other operating expense (income), net Total operating expenses & costs Income from operations Interest income Interest expense...
 Describe/ Explain the financial numbers in the attached Coca Cola
report such as EPS, EBIT,assets, liabilities, and other financial
numbers. (For example explain if the company is doing good or bad
based on the number from previous year 2016-2015). explain how the
financial numbers are used in the strategic planning process as
related to the products sold and markets the sell into?
THE COCA-COLA COMPANY AND SUBSIDIARIES CONSOLIDATED STATEMENTS OF INCOME 2016 2015 2014 (In millions except per share data)...
Describe/ Explain the financial numbers in the attached Coca Cola
report such as EPS, EBIT,assets, liabilities, and other financial
numbers. (For example explain if the company is doing good or bad
based on the number from previous year 2016-2015). explain how the
financial numbers are used in the strategic planning process as
related to the products sold and markets the sell into?
THE COCA-COLA COMPANY AND SUBSIDIARIES CONSOLIDATED STATEMENTS OF INCOME 2016 2015 2014 (In millions except per share data)...
 Find ratio analysis for liquidity and efficiency COSTCO WHOLESALE CORPORATION CONSOLIDATED BALANCE SHEETS (amounts in millions, except par value and share data) September 3, 2017 August 28, 2016 $ 4,546 1,233 1,432 9,834 1,350 1,252 8,969 ASSETS CURRENT ASSETS Cash and cash equivalents ........... Short-term investments ............. Receivables, net ............ Merchandise inventories ...... Other current assets... Total current assets PROPERTY AND EQUIPMENT Land .. Buildings and improvements... Equipment and fixtures Construction in progress... 272 268 17,317 15.218 5,690 15,127 6,681...
 Calculate the company's debt to total assets ratio (also called total debt ratio) for both the recent year and the prior year. Show your computations. Write the textbook formula here: Recent year: Prior year: Explain what information this ratio provides (define), and what the results mean to this company. Use complete sentences and your own words. Compare the two, has the ratio improved? The Procter& Gamble Company 37 Consolidated Statements of Earnings 2018 2017 2016 NET SALES S 66,832 S...
 Current ratio
Quick ratio
Debt to equity ratio
Times interest earned ratio
Receivables turnover ratio
Average collection period
Inventory turnover ratio
Average days inventory held
Payables turnover ratio
Average days payables outstanding
Asset turnover ratio
Profit margin on sales
Return on assets (ROA)
Return on shareholders' equity (ROE)
To calculate the above statement using the following
material:
FORD MOTOR COMPANY AND SUBSIDIARIES CONSOLIDATED BALANCE SHEET (in millions) December 31 2018 December 31 2017 ASSETS Cash and cash equivalents (Note 9)...
Current ratio
Quick ratio
Debt to equity ratio
Times interest earned ratio
Receivables turnover ratio
Average collection period
Inventory turnover ratio
Average days inventory held
Payables turnover ratio
Average days payables outstanding
Asset turnover ratio
Profit margin on sales
Return on assets (ROA)
Return on shareholders' equity (ROE)
To calculate the above statement using the following
material:
FORD MOTOR COMPANY AND SUBSIDIARIES CONSOLIDATED BALANCE SHEET (in millions) December 31 2018 December 31 2017 ASSETS Cash and cash equivalents (Note 9)...
 calculate
ROA
ROE
gross profit margin
quick ratio
debt to equity ratio
inventory turnover
calculate 2018 and 2019
1. ROA 2.DE 3. Groos profit 4. Quick ratio. 5. Debt to equity ratio: 6. Inventory turnover. nogin Eligibler Net Income = Total Revene- Total Expense. Total Assets = Liabilities + Owner's Equity Gross protit margin = (sales - rest of guels sodel/sales. 1. ROA 2. ROE 4. Quick ratio. 5. Debt to equity ratio. 6. Inventay turnover. 3. Gross protit Margin...
calculate
ROA
ROE
gross profit margin
quick ratio
debt to equity ratio
inventory turnover
calculate 2018 and 2019
1. ROA 2.DE 3. Groos profit 4. Quick ratio. 5. Debt to equity ratio: 6. Inventory turnover. nogin Eligibler Net Income = Total Revene- Total Expense. Total Assets = Liabilities + Owner's Equity Gross protit margin = (sales - rest of guels sodel/sales. 1. ROA 2. ROE 4. Quick ratio. 5. Debt to equity ratio. 6. Inventay turnover. 3. Gross protit Margin...
 Questions: What was the $value of gross trade receivables for
2019 and 2018?
What was the receivables turnover for 2019?
Compute the changes in cash, cash equivalents and receivables
from 2018 to 2019.
Please indicate the sheet the answer same from than you so
much.
THE COCA-COLA COMPANY AND SUBSIDIARIES CONSOLIDATED STATEMENTS OF INCOME (In millions except per share data) 2019 2018 2017 S 37,266 14,619 22,647 12,103 34,300 $ 13,067 21,233 11,002 1,079 9,152 689 950 36,212 13,721 22,491...
Questions: What was the $value of gross trade receivables for
2019 and 2018?
What was the receivables turnover for 2019?
Compute the changes in cash, cash equivalents and receivables
from 2018 to 2019.
Please indicate the sheet the answer same from than you so
much.
THE COCA-COLA COMPANY AND SUBSIDIARIES CONSOLIDATED STATEMENTS OF INCOME (In millions except per share data) 2019 2018 2017 S 37,266 14,619 22,647 12,103 34,300 $ 13,067 21,233 11,002 1,079 9,152 689 950 36,212 13,721 22,491...
 Were the dividends on common stock and/or preferred stock? What
was the amount of each?
Did Retained Earnings change for any reasons other than net
income or dividends? Explain.
What classes of stock does your company have?
How many shares of each class of stock are authorized, how many
are issued, and how many are outstanding?
Does your company have any treasury stock? How many shares and
what dollar amount?
What is the par or stated value of each of...
Were the dividends on common stock and/or preferred stock? What
was the amount of each?
Did Retained Earnings change for any reasons other than net
income or dividends? Explain.
What classes of stock does your company have?
How many shares of each class of stock are authorized, how many
are issued, and how many are outstanding?
Does your company have any treasury stock? How many shares and
what dollar amount?
What is the par or stated value of each of...
 COSTCO WHOLESALE CORPORATION CONSOLIDATED BALANCE SHEETS (amounts in millions, except par value and share data) September 2, September 3, 2017 2018 $ ASSETS CURRENT ASSETS Cash and cash equivalents .... Short-term investments .... Receivables, net. Merchandise inventories ..... Other current assets ...... Total current assets .... PROPERTY AND EQUIPMENT 6.055 1,204 1,669 11.040 321 20.289 4,546 1,233 1.432 9.834 272 17,317 Land Buildings and improvements. Equipment and futures Construction in progress 6,193 16.107 7.274 1.140 30.714 (11.033) 19,681 5,690 15,127...
Most questions answered within 3 hours.
-
Do not neglect the old for the new. The existing business must
not lose priority simply...
asked 2 hours ago -
Kylie is a single mom with two dependent children,
Tanner, age 7 and Olivia, age 11....
asked 3 hours ago -
Phosphorous + bromine = phosphorous tribromide. If 35.0 g of
bromine are reacted and 27.9 grams...
asked 4 hours ago -
Derive the long wavelength limit of the Planck energy density
distribution
asked 4 hours ago -
Calculate the pH of each of the following solutions.
0.50 M HBr
3.1×10⁻⁴ M KOH
4.2×10⁻⁵...
asked 8 hours ago -
For the year ended December 31, Depot Max’s cost of merchandise
sold was $85,600. Inventory at the...
asked 8 hours ago -
Week 10 - Professional Memo Assignment
Professional Memo Assignment
Your mission for this week, should you...
asked 8 hours ago -
Write a Python program that stores the data for each
player on the team, and it...
asked 8 hours ago -
In
the last 3 months, mike never knows when he is going to get his
allowance...
asked 8 hours ago -
Is Ca(OH)2 a Bronsted base, Lewis base, or both? Why?
asked 8 hours ago -
1A- Why don’t voters complain about U.S. tariffs on imported
sugar?
Because sugar is only a...
asked 8 hours ago -
Cash Payback Period
Primera Banco is evaluating two capital investment proposals for
a drive-up ATM kiosk,...
asked 8 hours ago