The Coca-Cola Company and PepsiCo, Inc.
The financial statements of Coca-Cola and PepsiCo are presented in Appendices C and D, respectively. The companies' complete annual reports, including the notes to the financial statements, are available online.
Instructions
Use the companies' financial information to answer the following questions.
a. Based on the information contained in these financial statements, determine each of the following for each company.
1. Cash used in (for) investing activities during 2017 (from the statement of cash flows).
2. What was the total other comprehensive income for the year 2017?
3. What was the unrealized gains or losses reported as part of other comprehensive income?
b. Identify from Coca-Cola's December 31, 2017, balance sheet the investments it reported as being accounted for under the equity method.
c. In Note 3, what is Coca-Cola's policy regarding its cost method investments?


Homework Answers
| a.1 | Cash used in (for) investing activities during 2017 (from the statement of cash flows) | ||
| Particulars | Coca-Cola Company | PepsiCo, Inc. | |
| Cash used in (for) investing activities during 2017 | -2385 | -4403 | |
| a.2 | Total other comprehensive income for the year 2017 | ||
| Particulars | Coca-Cola Company | PepsiCo, Inc. | |
| Total other comprehensive income for the year 2017 | 938 | 862 | |
| Particulars | Coca-Cola Company | ||
| Net foreign currency translation adjustment | 861 | ||
| Net gain (loss) on derivatives | -433 | ||
| Net unrealized gain (loss) on available-for-sale securities | 188 | ||
| Net change in pension and other benefit liabilities | 322 | ||
| Total other comprehensive income for the year 2017 | 938 | ||
| a.3 | Unrealized gains or losses reported as part of other comprehensive income | ||
| Particulars | Coca-Cola Company | PepsiCo, Inc. | |
| Unrealized gains or losses reported as part of other comprehensive income | 188 | -68 | |
| b | Investments reported by Coca Cola as being accounted for under the equity method | ||
| Particulars | Coca-Cola Company | ||
| Investments under the equity method | 20856 |
| c | Coca-Cola's policy regarding its cost method investments in Note 3 | ||
| Cost method investments are initially recorded at cost, and dividend income are recoreded when applicable dividends are declared. Cost method investments are reported as other investments in consolidated balance sheets, and dividend income from cost method investments is reported in other income (loss) — net inconsolidated statements of income. All cost method investments are reviewed quarterly to determine if impairment indicators are present. When impairment indicators exist, discounted cash flow analyses is used to determine the fair value. | |||
| (*taken from Coca Cola's Annual Report 2017) |
Add Answer to:
The Coca-Cola Company and PepsiCo, Inc.
The financial statements of Coca-Cola and PepsiCo are presented
in...
Comparative Analysis Case The Coca-Cola Company and PepsiCo, Inc. The financial statements of Coca-Cola and PepsiCo...
 Comparative Analysis Case The Coca-Cola Company and PepsiCo, Inc. The financial statements of Coca-Cola and PepsiCo are presented in Appendices C and D, respectively. The companies' complete annual reports, including the notes to the financial statements, are available online. Instructions Use the companies' financial information to answer the following questions. a. What kind of pension plans do Coca-Cola and PepsiCo provide their employees? b. What net periodic pension expense (cost) did Coca-Cola and PepsiCo report in 2017? c. What is...
Comparative Analysis Casemobivio de The Coca-Cola Company and PepsiCo, Inc. The financial statements of Coca-Cola and...
 Comparative Analysis Casemobivio de The Coca-Cola Company and PepsiCo, Inc. The financial statements of Coca-Cola and PepsiCo are presented in Appendices C and D, respectively. The companies' complete annual reports, including the notes to the financial statements, are available online. Stock price data can be found in the company's annual 10K, filed at the SEC. Instructions Use the companies' financial information to answer the following questions. a. What is the par or stated value of Coca-Cola's and PepsiCo's common or...
Describe/ Explain the financial numbers in the attached Coca Cola report such as EPS, EBIT,assets, liabilities,...
 Describe/ Explain the financial numbers in the attached Coca Cola
report such as EPS, EBIT,assets, liabilities, and other financial
numbers. (For example explain if the company is doing good or bad
based on the number from previous year 2016-2015). explain how the
financial numbers are used in the strategic planning process as
related to the products sold and markets the sell into?
THE COCA-COLA COMPANY AND SUBSIDIARIES CONSOLIDATED STATEMENTS OF INCOME 2016 2015 2014 (In millions except per share data)...
Describe/ Explain the financial numbers in the attached Coca Cola
report such as EPS, EBIT,assets, liabilities, and other financial
numbers. (For example explain if the company is doing good or bad
based on the number from previous year 2016-2015). explain how the
financial numbers are used in the strategic planning process as
related to the products sold and markets the sell into?
THE COCA-COLA COMPANY AND SUBSIDIARIES CONSOLIDATED STATEMENTS OF INCOME 2016 2015 2014 (In millions except per share data)...
3. Using the attached excerpts from Coca Cola's 2018 Annual Report (financial statements and Note 8:...
 3. Using the attached excerpts from Coca Cola's 2018 Annual Report (financial statements and Note 8: Property, Plant, and Equipment) answer the following questions. In addition: - All numbers are in Smillions (except per share data). - Provide calculations when necessary. a. Long-term Assets i) ii) iii) What is the total value of Coca Cola's long-term assets as of December 31, 2018? What is the net book value (NBV) of Coca Cola's property, plant and equipment as of December 31,...
The Coca-Cola Company and PepsiCo, Inc. The financial statements of Coca-Cola and PepsiCo are presented in...
The Coca-Cola Company and PepsiCo, Inc. The financial statements of Coca-Cola and PepsiCo are presented in Appendices C and D, respectively. The companies' complete annual reports, including the notes to the financial statements, are available online. Instructions Use the companies' financial information to answer the following questions. a. What were Coca-Cola's and PepsiCo's net revenues (sales) for the year 2017? Which company increased its revenue more (dollars and percentage) from 2016 to 2017? b. Are the revenue recognition policies of...
Questions: What was the $value of gross trade receivables for 2019 and 2018? What was the...
 Questions: What was the $value of gross trade receivables for
2019 and 2018?
What was the receivables turnover for 2019?
Compute the changes in cash, cash equivalents and receivables
from 2018 to 2019.
Please indicate the sheet the answer same from than you so
much.
THE COCA-COLA COMPANY AND SUBSIDIARIES CONSOLIDATED STATEMENTS OF INCOME (In millions except per share data) 2019 2018 2017 S 37,266 14,619 22,647 12,103 34,300 $ 13,067 21,233 11,002 1,079 9,152 689 950 36,212 13,721 22,491...
Questions: What was the $value of gross trade receivables for
2019 and 2018?
What was the receivables turnover for 2019?
Compute the changes in cash, cash equivalents and receivables
from 2018 to 2019.
Please indicate the sheet the answer same from than you so
much.
THE COCA-COLA COMPANY AND SUBSIDIARIES CONSOLIDATED STATEMENTS OF INCOME (In millions except per share data) 2019 2018 2017 S 37,266 14,619 22,647 12,103 34,300 $ 13,067 21,233 11,002 1,079 9,152 689 950 36,212 13,721 22,491...
what is the times interest earned ratio for 2017 Consolidated Statement of Income PepsiCo, Inc. and...
 what is the times interest earned ratio for 2017
Consolidated Statement of Income PepsiCo, Inc. and Subsidiaries Fiscal years ended December 27, 2017, December 28, 2016 and December 29, 2015 (in millions except per share amounts) $ $ 2017 63,525 28,785 34,740 24,231 2016 62,799 $ 28,209 34,590 24,805 2015 63,056 28,731 34,325 24,613 1,359 8,353 (970) +5+) 10,509 (1,151) 244 9,602 4,694 59 Net Revenue Cost of sales Gross profit Selling, general and administrative expenses Venezuela impairment charges Operating...
what is the times interest earned ratio for 2017
Consolidated Statement of Income PepsiCo, Inc. and Subsidiaries Fiscal years ended December 27, 2017, December 28, 2016 and December 29, 2015 (in millions except per share amounts) $ $ 2017 63,525 28,785 34,740 24,231 2016 62,799 $ 28,209 34,590 24,805 2015 63,056 28,731 34,325 24,613 1,359 8,353 (970) +5+) 10,509 (1,151) 244 9,602 4,694 59 Net Revenue Cost of sales Gross profit Selling, general and administrative expenses Venezuela impairment charges Operating...
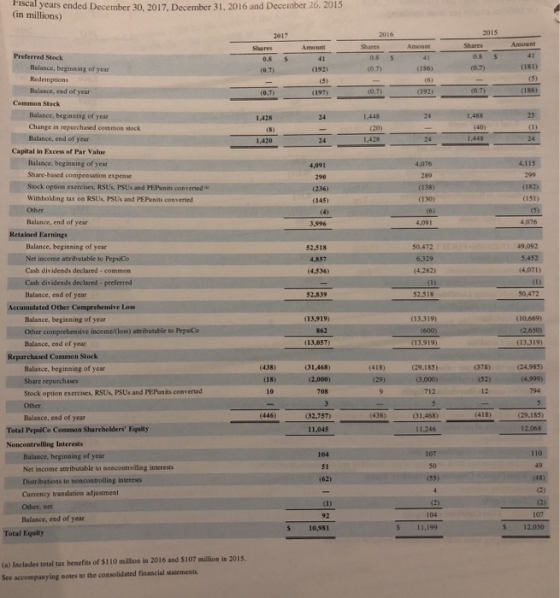
Were the dividends on common stock and/or preferred stock? What was the amount of each? Did...
 Were the dividends on common stock and/or preferred stock? What
was the amount of each?
Did Retained Earnings change for any reasons other than net
income or dividends? Explain.
What classes of stock does your company have?
How many shares of each class of stock are authorized, how many
are issued, and how many are outstanding?
Does your company have any treasury stock? How many shares and
what dollar amount?
What is the par or stated value of each of...
Were the dividends on common stock and/or preferred stock? What
was the amount of each?
Did Retained Earnings change for any reasons other than net
income or dividends? Explain.
What classes of stock does your company have?
How many shares of each class of stock are authorized, how many
are issued, and how many are outstanding?
Does your company have any treasury stock? How many shares and
what dollar amount?
What is the par or stated value of each of...
AR inancial Statements: Wal-Mart Stores, Inc. ores, Inc.'s financial statements as presented in the company's 2016...
 AR inancial Statements: Wal-Mart Stores, Inc. ores, Inc.'s financial statements as presented in the company's 2016 annual report. The complete annual report, including notes to site. Consolidated Statements of Income Facal than inded onuary at 2016 2015 2014 Revenues Neties Membership and other income Total revenues Costs and expenses 547 614 3,516 82110 70 3.218 06.294 5651 Operating ng general and administrave expenses Operating income 10084 97,041 24,105 93418 27.147 97253 26,82 2027 2161 Capital lease and financing obligations 2,467...
 Comparative Analysis Case The Coca-Cola Company and PepsiCo, Inc. The financial statements of Coca-Cola and PepsiCo are presented in Appendices C and D, respectively. The companies' complete annual reports, including the notes to the financial statements, are available online. Instructions Use the companies' financial information to answer the following questions. a. What kind of pension plans do Coca-Cola and PepsiCo provide their employees? b. What net periodic pension expense (cost) did Coca-Cola and PepsiCo report in 2017? c. What is...
 Comparative Analysis Casemobivio de The Coca-Cola Company and PepsiCo, Inc. The financial statements of Coca-Cola and PepsiCo are presented in Appendices C and D, respectively. The companies' complete annual reports, including the notes to the financial statements, are available online. Stock price data can be found in the company's annual 10K, filed at the SEC. Instructions Use the companies' financial information to answer the following questions. a. What is the par or stated value of Coca-Cola's and PepsiCo's common or...
 Describe/ Explain the financial numbers in the attached Coca Cola
report such as EPS, EBIT,assets, liabilities, and other financial
numbers. (For example explain if the company is doing good or bad
based on the number from previous year 2016-2015). explain how the
financial numbers are used in the strategic planning process as
related to the products sold and markets the sell into?
THE COCA-COLA COMPANY AND SUBSIDIARIES CONSOLIDATED STATEMENTS OF INCOME 2016 2015 2014 (In millions except per share data)...
Describe/ Explain the financial numbers in the attached Coca Cola
report such as EPS, EBIT,assets, liabilities, and other financial
numbers. (For example explain if the company is doing good or bad
based on the number from previous year 2016-2015). explain how the
financial numbers are used in the strategic planning process as
related to the products sold and markets the sell into?
THE COCA-COLA COMPANY AND SUBSIDIARIES CONSOLIDATED STATEMENTS OF INCOME 2016 2015 2014 (In millions except per share data)...
 3. Using the attached excerpts from Coca Cola's 2018 Annual Report (financial statements and Note 8: Property, Plant, and Equipment) answer the following questions. In addition: - All numbers are in Smillions (except per share data). - Provide calculations when necessary. a. Long-term Assets i) ii) iii) What is the total value of Coca Cola's long-term assets as of December 31, 2018? What is the net book value (NBV) of Coca Cola's property, plant and equipment as of December 31,...
 Questions: What was the $value of gross trade receivables for
2019 and 2018?
What was the receivables turnover for 2019?
Compute the changes in cash, cash equivalents and receivables
from 2018 to 2019.
Please indicate the sheet the answer same from than you so
much.
THE COCA-COLA COMPANY AND SUBSIDIARIES CONSOLIDATED STATEMENTS OF INCOME (In millions except per share data) 2019 2018 2017 S 37,266 14,619 22,647 12,103 34,300 $ 13,067 21,233 11,002 1,079 9,152 689 950 36,212 13,721 22,491...
Questions: What was the $value of gross trade receivables for
2019 and 2018?
What was the receivables turnover for 2019?
Compute the changes in cash, cash equivalents and receivables
from 2018 to 2019.
Please indicate the sheet the answer same from than you so
much.
THE COCA-COLA COMPANY AND SUBSIDIARIES CONSOLIDATED STATEMENTS OF INCOME (In millions except per share data) 2019 2018 2017 S 37,266 14,619 22,647 12,103 34,300 $ 13,067 21,233 11,002 1,079 9,152 689 950 36,212 13,721 22,491...
 what is the times interest earned ratio for 2017
Consolidated Statement of Income PepsiCo, Inc. and Subsidiaries Fiscal years ended December 27, 2017, December 28, 2016 and December 29, 2015 (in millions except per share amounts) $ $ 2017 63,525 28,785 34,740 24,231 2016 62,799 $ 28,209 34,590 24,805 2015 63,056 28,731 34,325 24,613 1,359 8,353 (970) +5+) 10,509 (1,151) 244 9,602 4,694 59 Net Revenue Cost of sales Gross profit Selling, general and administrative expenses Venezuela impairment charges Operating...
what is the times interest earned ratio for 2017
Consolidated Statement of Income PepsiCo, Inc. and Subsidiaries Fiscal years ended December 27, 2017, December 28, 2016 and December 29, 2015 (in millions except per share amounts) $ $ 2017 63,525 28,785 34,740 24,231 2016 62,799 $ 28,209 34,590 24,805 2015 63,056 28,731 34,325 24,613 1,359 8,353 (970) +5+) 10,509 (1,151) 244 9,602 4,694 59 Net Revenue Cost of sales Gross profit Selling, general and administrative expenses Venezuela impairment charges Operating...
 Were the dividends on common stock and/or preferred stock? What
was the amount of each?
Did Retained Earnings change for any reasons other than net
income or dividends? Explain.
What classes of stock does your company have?
How many shares of each class of stock are authorized, how many
are issued, and how many are outstanding?
Does your company have any treasury stock? How many shares and
what dollar amount?
What is the par or stated value of each of...
Were the dividends on common stock and/or preferred stock? What
was the amount of each?
Did Retained Earnings change for any reasons other than net
income or dividends? Explain.
What classes of stock does your company have?
How many shares of each class of stock are authorized, how many
are issued, and how many are outstanding?
Does your company have any treasury stock? How many shares and
what dollar amount?
What is the par or stated value of each of...
 AR inancial Statements: Wal-Mart Stores, Inc. ores, Inc.'s financial statements as presented in the company's 2016 annual report. The complete annual report, including notes to site. Consolidated Statements of Income Facal than inded onuary at 2016 2015 2014 Revenues Neties Membership and other income Total revenues Costs and expenses 547 614 3,516 82110 70 3.218 06.294 5651 Operating ng general and administrave expenses Operating income 10084 97,041 24,105 93418 27.147 97253 26,82 2027 2161 Capital lease and financing obligations 2,467...
Most questions answered within 3 hours.
-
How does neutralisation of IL-6 trans-signaling affect the
autoimmune disease and inflammation? What if the trans-signaling...
asked 1 minute ago -
f an allele is 'fixed' in a population, what is its
frequency?
0.50
0.75
0.25
0...
asked 15 minutes ago -
Do we have a duty of national loyalty in business? What is the
major argument in...
asked 15 minutes ago -
The test statistic used in the F test for the equality of two
variances is calculated...
asked 10 minutes ago -
compare the international treatment of segment reporting to the
us gaap treatment
asked 12 minutes ago -
A statistics student finds herself struggling with a newspaper
article stating that only eighteen percent of...
asked 45 minutes ago -
People with beriberi, a disease caused by a thiamin deficiency,
have elevated levels of blood pyruvate...
asked 32 minutes ago -
PYTHON Programming Exercise 2: Create a Simple Cost Calculator
Write a program that displays input fields...
asked 38 minutes ago -
1.Seki agreed that Groupon could sell 18 hot air
balloon rides on his Magical Adventures company...
asked 39 minutes ago -
A cohort study is conducted to determine whether smoking is
associated with an increased risk of...
asked 45 minutes ago -
Create the pseudo-code/flowchart for an application class named
Monogram. Its main() method inputs three variables that...
asked 45 minutes ago -
How many liters of water are required to dissolve 1.00 g of
silver chromate? Express your...
asked 48 minutes ago