
Homework Answers


Add Answer to:
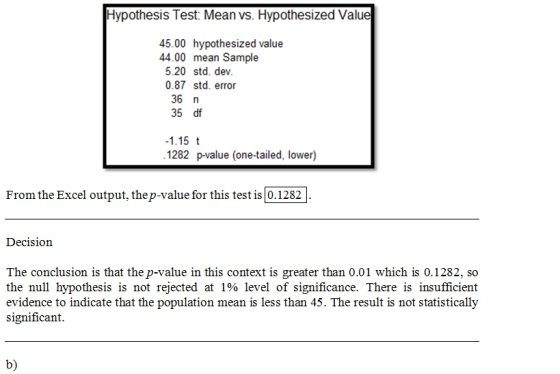
Consider the following hypothesis test: Ho: ?> 45 Ha: ? < 45 A sample of 36...
Consider the following hypothesis test: Ho: μ 50 Ha: μ > 50 A sample of 50...
 Consider the following hypothesis test: Ho: μ 50 Ha: μ > 50 A sample of 50 is used and the population standard deviation is 6. Use the critical value approach to state your conclusion for each of the following sample results. Use 05. a. With = 52.5, what is the value of the test statistic (to 2 decimals)? Can it be concluded that the population mean is greater than 50? | Select ▼ b. With C-51, what is the value...
eBook Exercise 9.13 (Algorithmic) Consider the following hypothesis test: но: 50 Ha: μ > 50 A...
 eBook Exercise 9.13 (Algorithmic) Consider the following hypothesis test: но: 50 Ha: μ > 50 A sample of 55 is used and the population standard deviation is 7. Use the critical value approach to state your conclusion for each of the following sample results. Use a-.05 a. With x = 52.5, what is the value of the test statistic (to 2 decimals)? Can it be concluded that the population mean is greater than 50? Select your answer b. With x-51,...
3-7 Consider the following hypothesis test: Ho: u=15 Ha: u15 A sample of 40 provided a...
 3-7
Consider the following hypothesis test: Ho: u=15 Ha: u15 A sample of 40 provided a sample mean of 14.16. The population standard deviation is 6. Enter negative value as negative number. a. Compute the value of the test statistic (to 2 decimals) b. What is the p-value (to 4 decimals)? Use the value of the test statistic rounded to 2 decimal places in your calculations. c. Using a 0.05, can it be concluded that the population mean is not...
3-7
Consider the following hypothesis test: Ho: u=15 Ha: u15 A sample of 40 provided a sample mean of 14.16. The population standard deviation is 6. Enter negative value as negative number. a. Compute the value of the test statistic (to 2 decimals) b. What is the p-value (to 4 decimals)? Use the value of the test statistic rounded to 2 decimal places in your calculations. c. Using a 0.05, can it be concluded that the population mean is not...
{Exercise 9.09 (Algorithmic).} Consider the following hypothesis test: Ho: u 20 Ha: p < 20 A...
 {Exercise 9.09 (Algorithmic).} Consider the following hypothesis test: Ho: u 20 Ha: p < 20 A sample of 40 provided a sample mean of 19.6. The population standard deviation is 1.8. a. Compute the value of the test statistic (to 2 decimals). -1.64 b. What is the p-value (to 3 decimals)? -1.757 X c. Using a = .05, can it be concluded that the population mean is less than 20? No d. Using a = .05, what is the critical...
Consider the following hypothesis test: Ho: 50 Hai 4 > 50 A sample of 65 is...
 Consider the following hypothesis test: Ho: 50 Hai 4 > 50 A sample of 65 is used and the population standard deviation is 8. Use the critical value approach to state your conclusion for each of the following sample results. Use a = .05. a. With 2 = 52.5, what is the value of the test statistic (to 2 decimals)? Can it be concluded that the population mean is greater than 50? Yes b. With 2 - 51, what is...
Consider the following hypothesis test: Ho: u = 15 Hai ji #15 A sample of 50...
 Consider the following hypothesis test: Ho: u = 15 Hai ji #15 A sample of 50 provided a sample mean of 14.15. The population standard deviation is 4. Enter negative value as negative number. a. Compute the value of the test statistic (to 2 decimals). -.03 b. What is the p-value (to 4 decimals)? Use the value of the test statistic rounded to 2 decimal places in your calculations. c. Using a = 0.05, can it be concluded that the...
Consider the following hypothesis test: H 0: 20 H a: < 20 A sample of 60 provided a...
Consider the following hypothesis test: H 0: 20 H a: < 20 A sample of 60 provided a sample mean of 19.5. The population standard deviation is 2. a. Compute the value of the test statistic (to 2 decimals). If your answer is negative, use minus "-" sign. b. What is the p-value (to 3 decimals)? c. Using = .05, can it be concluded that the population mean is less than 20? SelectYesNoItem 3 d. Using = .05, what is the critical value for...
Consider the following hypothesis test: H 0: 20 H a: < 20 A sample of 55...
Consider the following hypothesis test: H 0: 20 H a: < 20 A sample of 55 provided a sample mean of 19.6. The population standard deviation is 1.6. a. Compute the value of the test statistic (to 2 decimals). If your answer is negative, use minus "-" sign. b. What is the p-value (to 3 decimals)? c. Using = .05, can it be concluded that the population mean is less than 20? d. Using = .05, what is the critical...
Consider the following hypothesis test: H 0: 50 H a: > 50 A sample of 70...
Consider the following hypothesis test: H 0: 50 H a: > 50 A sample of 70 is used and the population standard deviation is 9. Use the critical value approach to state your conclusion for each of the following sample results. Use = .05. a. With = 52.5, what is the value of the test statistic (to 2 decimals)? Can it be concluded that the population mean is greater than 50? b. With = 51, what is the value of...
Consider the following hypothesis test: Ho: µS 12 Ha: µ > 12 A sample of 25...
 Consider the following hypothesis test: Ho: µS 12 Ha: µ > 12 A sample of 25 provided a sample mean 14 and a sample standard deviation s= = 4.32. a. Compute the value of the test statistic (to 2 decimals). 2.31 b. Use the t distribution table (Table 2 in Appendix B) to compute a range for the p-value. The p-value is less than .005 Answer the next three questions using the critical value approach. C. Using a = 0.05,...
 Consider the following hypothesis test: Ho: μ 50 Ha: μ > 50 A sample of 50 is used and the population standard deviation is 6. Use the critical value approach to state your conclusion for each of the following sample results. Use 05. a. With = 52.5, what is the value of the test statistic (to 2 decimals)? Can it be concluded that the population mean is greater than 50? | Select ▼ b. With C-51, what is the value...
 eBook Exercise 9.13 (Algorithmic) Consider the following hypothesis test: но: 50 Ha: μ > 50 A sample of 55 is used and the population standard deviation is 7. Use the critical value approach to state your conclusion for each of the following sample results. Use a-.05 a. With x = 52.5, what is the value of the test statistic (to 2 decimals)? Can it be concluded that the population mean is greater than 50? Select your answer b. With x-51,...
 3-7
Consider the following hypothesis test: Ho: u=15 Ha: u15 A sample of 40 provided a sample mean of 14.16. The population standard deviation is 6. Enter negative value as negative number. a. Compute the value of the test statistic (to 2 decimals) b. What is the p-value (to 4 decimals)? Use the value of the test statistic rounded to 2 decimal places in your calculations. c. Using a 0.05, can it be concluded that the population mean is not...
3-7
Consider the following hypothesis test: Ho: u=15 Ha: u15 A sample of 40 provided a sample mean of 14.16. The population standard deviation is 6. Enter negative value as negative number. a. Compute the value of the test statistic (to 2 decimals) b. What is the p-value (to 4 decimals)? Use the value of the test statistic rounded to 2 decimal places in your calculations. c. Using a 0.05, can it be concluded that the population mean is not...
 {Exercise 9.09 (Algorithmic).} Consider the following hypothesis test: Ho: u 20 Ha: p < 20 A sample of 40 provided a sample mean of 19.6. The population standard deviation is 1.8. a. Compute the value of the test statistic (to 2 decimals). -1.64 b. What is the p-value (to 3 decimals)? -1.757 X c. Using a = .05, can it be concluded that the population mean is less than 20? No d. Using a = .05, what is the critical...
 Consider the following hypothesis test: Ho: 50 Hai 4 > 50 A sample of 65 is used and the population standard deviation is 8. Use the critical value approach to state your conclusion for each of the following sample results. Use a = .05. a. With 2 = 52.5, what is the value of the test statistic (to 2 decimals)? Can it be concluded that the population mean is greater than 50? Yes b. With 2 - 51, what is...
 Consider the following hypothesis test: Ho: u = 15 Hai ji #15 A sample of 50 provided a sample mean of 14.15. The population standard deviation is 4. Enter negative value as negative number. a. Compute the value of the test statistic (to 2 decimals). -.03 b. What is the p-value (to 4 decimals)? Use the value of the test statistic rounded to 2 decimal places in your calculations. c. Using a = 0.05, can it be concluded that the...
 Consider the following hypothesis test: Ho: µS 12 Ha: µ > 12 A sample of 25 provided a sample mean 14 and a sample standard deviation s= = 4.32. a. Compute the value of the test statistic (to 2 decimals). 2.31 b. Use the t distribution table (Table 2 in Appendix B) to compute a range for the p-value. The p-value is less than .005 Answer the next three questions using the critical value approach. C. Using a = 0.05,...
Most questions answered within 3 hours.
-
1. When a nearsighted person looks at an object that is in the
distance with their...
asked 5 minutes ago -
QUESTION 8
Both of these statements will store the same value in the
variable $number
$number...
asked 30 minutes ago -
The price of 1 lb of potatoes is $1.75. If all the potatoes sold
today at...
asked 1 hour ago -
Garcia Company issues 20.00%, 15-year bonds with a par value of
$470,000 and semiannual interest payments....
asked 1 hour ago -
In C++ Programming, Try using loops only.
This lab demonstrates the use of the While Loop...
asked 2 hours ago -
Effect of DCMU and sodium azide on Chlamydomonas? We did an
experiment where we had Chlamydomonas...
asked 2 hours ago -
1a) According to the ideal gas law, _______________.
a. a gas has infinite volume at absolute...
asked 4 hours ago -
Oakdale Fashions, Inc. had $245,000 in 2018 taxable income.
Using the tax schedule in Table 2.3...
asked 4 hours ago -
The marketing class at CSUS had an average score of 150. An
educational analyst determined that...
asked 6 hours ago -
Justin Case has purchased a $250 000 home by putting 20 % down
and taking out...
asked 6 hours ago -
1. In a labor market, marginal cost for a firm is
____________.
a. recruiting cost
b....
asked 6 hours ago -
On January 1, 2019, ABC Company issued $60,000,000 of 20-year,
10.5% bonds when the market rate...
asked 7 hours ago