
Homework Answers


Add Answer to:
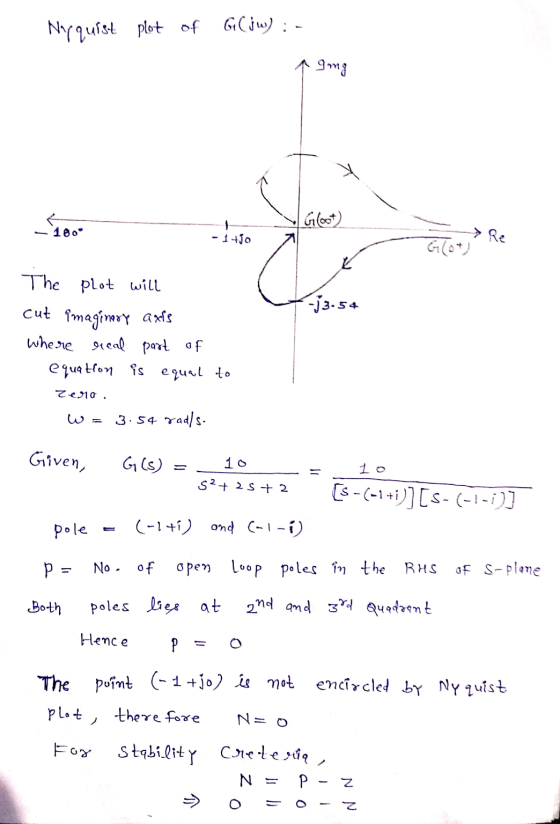
Exercise 1: Plot the Nyquist diagram of 10 G(s) = $? + 2s + 2 and...
A unity feedback control system has the open loop TF as
A unity feedback control system has the open loop TF as: \(G(s)=\frac{K(s+a+1)(s+b)}{s(s+a)(s+a+2)}\)a) Find analytical expressions for the magnitude and phase response for \(\mathrm{G}(\mathrm{s}) .\left[K=K_{1}\right]\)b) Make a plot of the log-magnitude and the phase, using log-frequency in rad/s as the ordinate. \(\left[K=K_{1}\right]\)c) Sketch the Bode asymptotic magnitude and asymptotic phase plots. \(\left[K=K_{1}\right]\)d) Compare the results from \((a),(b)\), and \((c) .\left[K=K_{1}\right]\)e) Using the Nyquist criterion, find out if system is stable. Show your steps. \(\left[K=K_{1}\right]\)f) Using the Nyquist criterion, find the range...
A unity feedback system has the following open-loop gain function 10 s(s+2) Use MATLAB to plot...
 A unity feedback system has the following open-loop gain function 10 s(s+2) Use MATLAB to plot the Bode plot of this system Find the gain and phase margin. Identify these margins on the Bode plot. Is the G(s) a. b. system stable?
The open loop transfer function of an electro-mechanical system with unity feedback is: 24K G(s) S(s+2)(s +6) The Nyquist diagram of G(s) has a shape similar to the one shown below Nyquist diagram Cl...
 The open loop transfer function of an electro-mechanical system with unity feedback is: 24K G(s) S(s+2)(s +6) The Nyquist diagram of G(s) has a shape similar to the one shown below Nyquist diagram Cl When K -1, calculate both the frequency and the gain at which the plot crosses the real axis Hence state the gain margin or critical gain Kc for this system. If K is chosen as K-0.2Kc, show that the gain G(jo) l at a frequency ω-1.308...
For the unity feedback system in the below figure, 1. EGO) R(s)) C(s) G(s)K (s 1) (s + 4) a) Sket...
 For the unity feedback system in the below figure, 1. EGO) R(s)) C(s) G(s)K (s 1) (s + 4) a) Sketch the bode plot with Matlab command bode0 b) Plot the nyquist diagram using Matlab command nyquist(0, find the system stability c) Find phase margin, gain margin, and crossover frequencies using Matlab command margin(0 and find the system stability
For the unity feedback system in the below figure, 1. EGO) R(s)) C(s) G(s)K (s 1) (s + 4) a) Sketch...
For the unity feedback system in the below figure, 1. EGO) R(s)) C(s) G(s)K (s 1) (s + 4) a) Sketch the bode plot with Matlab command bode0 b) Plot the nyquist diagram using Matlab command nyquist(0, find the system stability c) Find phase margin, gain margin, and crossover frequencies using Matlab command margin(0 and find the system stability
For the unity feedback system in the below figure, 1. EGO) R(s)) C(s) G(s)K (s 1) (s + 4) a) Sketch...
2. A unity feedback system has the following open-loop transfer function -0.5s + 0.5 G(s)i a)...
 2. A unity feedback system has the following open-loop transfer function -0.5s + 0.5 G(s)i a) Obtain the Nyquist plot and analyze the stability of the closed loop system b) Compute the stability margins from the Nyquist plot.
For a unity feedback system as shown in Fig. 1, where 10(92 - 2s+2) G(8) =...
 For a unity feedback system as shown in Fig. 1, where 10(92 - 2s+2) G(8) = (5+1)(+ 2s +1) the Nyquist plot is shown in Figure 2 (a) Complete the Nyquist stability analysis for the system (b) If the system becomes G(s) = - 10(32 +28+2) (8 + 1)(s2 - 2s + 1)' with the Nyquist plot shown in Figure 3, is the closed-loop system stable? Complete the Nyquist stability analysis on this system. Figure 1: Pre- Imaginary Axis Imaginary...
3. Construct the bode plot on a semilog Graph-paper for a unity feedback system whose open...
 Construct the bode plot on a semilog Graph-paper for a unity feedback system whose open looptransfer function is given by \(G(S)=\frac{100}{S(S+1)(2+S)} .\) From the bode plot determinea) Gain and phase crossover frequencies.b) Gain and Phase margin, andc) Stability of the closed loop system
I am stuck on how to create the transfer function to be suitable for a bide plot, then actually plotting the Bode diagram Question 3 A third order process is to be controlled by a proportional con...
 I am stuck on how to create the transfer function to
be suitable for a bide plot, then actually plotting the Bode
diagram
Question 3 A third order process is to be controlled by a proportional controller (Kp) and is to havea unity feedback closed loop arrangement. The process consists of three first order lags that have the following parameters GP1-1s+1) GP2 8/(s+2) GP3 5(s+0.2) A) Draw the system closed block diagram 3 marks B) Using the Log-Linear graph paper...
I am stuck on how to create the transfer function to
be suitable for a bide plot, then actually plotting the Bode
diagram
Question 3 A third order process is to be controlled by a proportional controller (Kp) and is to havea unity feedback closed loop arrangement. The process consists of three first order lags that have the following parameters GP1-1s+1) GP2 8/(s+2) GP3 5(s+0.2) A) Draw the system closed block diagram 3 marks B) Using the Log-Linear graph paper...
b) The Nyquist plot of a unity feedback control system is as shown in Figure Q5(b)....
 b) The Nyquist plot of a unity feedback control system is as shown in Figure Q5(b). Nyqulst Diagram x 10 1.5 1- System: N Real: -9.08e-005 0.5- Imag: -5.62e-006 Frequency (rad/sec): -104 -0.5 -15 -1.5 0.5 0.5 1.5 1 2.5 3.5 Real Axis x 10 Figure Q5(b) K If the transfer function of the system is given as G(s) (s+10)(s+50)(s+150) determine the following: The closed loop stability of the system using Nyquist Stability Criterion. i) ii) Gain margin and phase...
4. Consider a unity-feedback control system with the following open-loop transfer function: G(s)3 Sketch a Nyquist...
 4. Consider a unity-feedback control system with the following open-loop transfer function: G(s)3 Sketch a Nyquist plot of G(s) and examine the stability of the system.
 A unity feedback system has the following open-loop gain function 10 s(s+2) Use MATLAB to plot the Bode plot of this system Find the gain and phase margin. Identify these margins on the Bode plot. Is the G(s) a. b. system stable?
 The open loop transfer function of an electro-mechanical system with unity feedback is: 24K G(s) S(s+2)(s +6) The Nyquist diagram of G(s) has a shape similar to the one shown below Nyquist diagram Cl When K -1, calculate both the frequency and the gain at which the plot crosses the real axis Hence state the gain margin or critical gain Kc for this system. If K is chosen as K-0.2Kc, show that the gain G(jo) l at a frequency ω-1.308...
 For the unity feedback system in the below figure, 1. EGO) R(s)) C(s) G(s)K (s 1) (s + 4) a) Sketch the bode plot with Matlab command bode0 b) Plot the nyquist diagram using Matlab command nyquist(0, find the system stability c) Find phase margin, gain margin, and crossover frequencies using Matlab command margin(0 and find the system stability
For the unity feedback system in the below figure, 1. EGO) R(s)) C(s) G(s)K (s 1) (s + 4) a) Sketch...
For the unity feedback system in the below figure, 1. EGO) R(s)) C(s) G(s)K (s 1) (s + 4) a) Sketch the bode plot with Matlab command bode0 b) Plot the nyquist diagram using Matlab command nyquist(0, find the system stability c) Find phase margin, gain margin, and crossover frequencies using Matlab command margin(0 and find the system stability
For the unity feedback system in the below figure, 1. EGO) R(s)) C(s) G(s)K (s 1) (s + 4) a) Sketch...
 2. A unity feedback system has the following open-loop transfer function -0.5s + 0.5 G(s)i a) Obtain the Nyquist plot and analyze the stability of the closed loop system b) Compute the stability margins from the Nyquist plot.
 For a unity feedback system as shown in Fig. 1, where 10(92 - 2s+2) G(8) = (5+1)(+ 2s +1) the Nyquist plot is shown in Figure 2 (a) Complete the Nyquist stability analysis for the system (b) If the system becomes G(s) = - 10(32 +28+2) (8 + 1)(s2 - 2s + 1)' with the Nyquist plot shown in Figure 3, is the closed-loop system stable? Complete the Nyquist stability analysis on this system. Figure 1: Pre- Imaginary Axis Imaginary...
 Construct the bode plot on a semilog Graph-paper for a unity feedback system whose open looptransfer function is given by \(G(S)=\frac{100}{S(S+1)(2+S)} .\) From the bode plot determinea) Gain and phase crossover frequencies.b) Gain and Phase margin, andc) Stability of the closed loop system
 I am stuck on how to create the transfer function to
be suitable for a bide plot, then actually plotting the Bode
diagram
Question 3 A third order process is to be controlled by a proportional controller (Kp) and is to havea unity feedback closed loop arrangement. The process consists of three first order lags that have the following parameters GP1-1s+1) GP2 8/(s+2) GP3 5(s+0.2) A) Draw the system closed block diagram 3 marks B) Using the Log-Linear graph paper...
I am stuck on how to create the transfer function to
be suitable for a bide plot, then actually plotting the Bode
diagram
Question 3 A third order process is to be controlled by a proportional controller (Kp) and is to havea unity feedback closed loop arrangement. The process consists of three first order lags that have the following parameters GP1-1s+1) GP2 8/(s+2) GP3 5(s+0.2) A) Draw the system closed block diagram 3 marks B) Using the Log-Linear graph paper...
 b) The Nyquist plot of a unity feedback control system is as shown in Figure Q5(b). Nyqulst Diagram x 10 1.5 1- System: N Real: -9.08e-005 0.5- Imag: -5.62e-006 Frequency (rad/sec): -104 -0.5 -15 -1.5 0.5 0.5 1.5 1 2.5 3.5 Real Axis x 10 Figure Q5(b) K If the transfer function of the system is given as G(s) (s+10)(s+50)(s+150) determine the following: The closed loop stability of the system using Nyquist Stability Criterion. i) ii) Gain margin and phase...
 4. Consider a unity-feedback control system with the following open-loop transfer function: G(s)3 Sketch a Nyquist plot of G(s) and examine the stability of the system.
Most questions answered within 3 hours.
-
Write a program to solve the Josephus problem, with the following
modification:
Sample Input:
./a.out n...
asked 13 minutes ago -
At the start of a CD it is spinning at a rate of 525 rpm
(revolutions...
asked 49 minutes ago -
4. Without doing any calculations, predict whether the observed
∆T would increase, decrease or remain the...
asked 2 hours ago -
Based on the range, which of the following sets of scores has
the greatest variability? 3,...
asked 3 hours ago -
Ripples in a pond travel at a velocity of 3 m/s with one peak
passing a...
asked 3 hours ago -
A man stands on the roof of a building of height 13.0 mm and
throws a...
asked 3 hours ago -
The extent to which assets are financed by borrowed funds and
other liabilities is indicated by:...
asked 4 hours ago -
Explain in detail
Germany is the fifth largest economy
explain what goods and services Germany specializes...
asked 4 hours ago -
The density of platinum is 21.45 g/mL. If a cube of platinum
with a mass of...
asked 4 hours ago -
Accounts Receivable
Sales
A/R Posting
Extended Sales Invoice
Packing Slip
Compare invoice to packing slip 2...
asked 4 hours ago -
Michaella, age 23, is a full-time law student and is claimed by
her parents as a...
asked 4 hours ago -
Why are polymers not typically casted into products?
asked 4 hours ago