
Homework Answers
MATLAB CODE
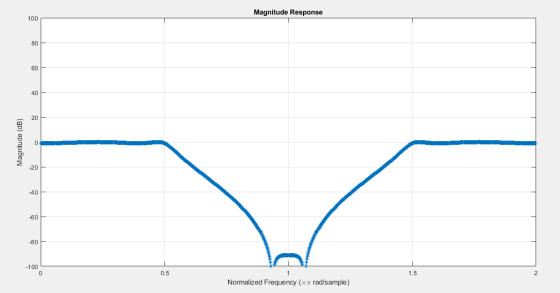
b=[0.0555,0.2221,0.3331,0.2221,0.0555]; % Numerator
Coefficient
a=[1,-0.7498,1.0725,-0.5598,0.2337]; %Denominator Coefficient
Fs=10e3; % Sampling Frequency
SysZ=tf(b,a,1/Fs) % Transfer Function
N=1024; % FFT Size
[h,w] = freqz(b,a,'whole',N);
figure(1)
plot(w/pi,20*log10(abs(h)),'*') % Magnitude Response
grid on
ax = gca;
ax.YLim = [-100 100];
ax.XTick = 0:.5:2;
xlabel('Normalized Frequency (\times\pi rad/sample)')
ylabel('Magnitude (dB)')
title('Magnitude Response')
figure(2)
zplane(b,a,'r') % Pole Zero plot
Result:
0.0555 z^4 + 0.2221 z^3 + 0.3331 z^2 + 0.2221 z + 0.0555
--------------------------------------------------------
z^4 - 0.7498 z^3 + 1.073 z^2 - 0.5598 z + 0.2337
Sample time: 0.0001 seconds
Discrete-time transfer function
Magnitude Response
Pole Zero Plot
Add Answer to:
Consider a 4th-order lowpass Chebychev I digital filter given by 0.055524 + 0.222173 +0.3331:2 +0.22212 +0.0555...
Create a 4th-order lowpass active Chebyshev filter with a 3-dB ripple in the pass band with...
Create a 4th-order lowpass active Chebyshev filter with a 3-dB ripple in the pass band with a corner frequency of 250 Hz using the Sallen-Key topology. Draw the final circuit and all component values. Create a Bode plot for the response at each stage and the overall response using MATLAB
Design lowpass IIR filter with the following specifications: Filter order = 2, Butterworth type C...
Design lowpass IIR filter with the following specifications: Filter order = 2, Butterworth type Cut-off frequency=800 Hz Sampling rate =8000 Hz Design using the bilinear z-transform design method Print the lowpass IIR filter coefficients and plot the frequency responses using MATLAB. MATLAB>>freqz(bLP,aLP,512,8000); axis([0 4000 –40 1]); Label and print your graph. What is the filter gain at the cut-off frequency 800 Hz? What are the filter gains for the stopband at 2000 Hz and the passband at 50 Hz based...
2. Perform a lowpass prototype transform, find, given the following digital filter frequency values. a. Low...
 2. Perform a lowpass prototype transform, find, given the following digital filter frequency values. a. Low pass filter with a cutoff of 750 Hz b. High pass filter with a cutoff of 12.57 rad/s c. Bandpass filter with a lower cutoff of 400 Hz and a higher cutoff 725 Hz d. Bandstop filter with a center frequency of 135.3 rad/s and a bandwidth of 84.74 rad/s
2. Design a digital lowpass filter to meet the following specifications: passband edge = 0.45π stopband...
2. Design a digital lowpass filter to meet the following specifications: passband edge = 0.45π stopband edge = 0.5π Rp = 0.5 dB, As = 60 dB a. Design a Buttterworth filter, you may use the butterord and butter commands to implement. b. Design Chebyshev Type 1 filter ( use the equivalent commands to above ) c. Design an Elliptic fitler ( use the equivalent commands to part a ). d. List the order of each filter and find the...
7.3. Design a 5-tap FIR lowpass filter with a cutoff frequency of 100 Hz and a...
 7.3. Design a 5-tap FIR lowpass filter with a cutoff frequency of 100 Hz and a sampling rate of 1,000 Hz using a a. rectangular window function b. Hamming window function Determine the transfer function and difference equation of the designed FIR system, and compute and plot the magnitude frequency response for ?--0, ?/4, ?/2, 3r/4, and ? radians.
The MATLAB program below designs a lowpass filter for a passband edge frequency of 250Hz and...
 The MATLAB program below designs a lowpass filter for a passband edge frequency of 250Hz and a stopband edge of 350Hz. The sampling frequency is 2kHz. A Hamming window is used. (a) The program is on Webcampus. Run it and copy and paste the wvtool plots into Word. % FIR Filter Design (using wvtool) % Lowpass Design clear fpass 250; fstop 350; fs 2000; wp 2*pi* fpass/ fs; ws 2* pi fstop / fs; M=ceil(6.6 * pi / (ws-wp)) +...
1. Design a 10th-order lowpass FIR filter using the window method (fir1) to cut frequencies above...
1. Design a 10th-order lowpass FIR filter using the window method (fir1) to cut frequencies above 30Hz in an application where the sampling frequency is 125 Hz. 2. Plot the filter coefficients that define the filter (stem). 3. Plot the frequency response of the FIR filter designed (freqz) 4. Design a 100th-order lowpass FIR filter using the window method (fir1) to cut frequencies above 30Hz in an application where the sampling frequency is 125 Hz. Plot the filter coefficients that...
2. (50 marks) Consider using the impulse invariance method to design a prototype IIR digital filter...
 2. (50 marks) Consider using the impulse invariance method to design a prototype IIR digital filter corresponding to the analogue prototype filter: He(s) = 52 +58 +6 a) Write the correct sequence of basic steps involved in this method. b) Determine the transfer function H(z) of the resulting digital filter. Simplify H(2) as much as possible. Assume a sampling frequency of fs = 100 HZ.
please need correct answer. I will upvote. Design a second-order digital bandpass Butterworth filter with a...
please need correct answer. I will upvote. Design a second-order digital bandpass Butterworth filter with a lower cutoff frequency of 1.9 kHz, an upper cutoff frequency 2.1 kHz, and a passband ripple of 3dB at a sampling frequency of 8,000 Hz. a. Determine the transfer function and difference equation. b. Use MATLAB to plot the magnitude and phase frequency respon
Discrete Time Signal Processing Question 1. Consider an IIR filter A(1-2-1 cos ω0) 1-2cos ω02-1+2...
 Discrete Time Signal Processing Question 1. Consider an IIR filter A(1-2-1 cos ω0) 1-2cos ω02-1+2 I. Compute its impulse response using the difference equation with an impulse signal δ(n) as the input. Use trigonometric identities to simplify the result as much as you can 2. Draw the diagram showing the implementation of this filter in terms of adders, delays and multipliers Note: The IIR filter above generates a cosinusoidal signal when an impulse signal is applied at its input.] Question...
 2. Perform a lowpass prototype transform, find, given the following digital filter frequency values. a. Low pass filter with a cutoff of 750 Hz b. High pass filter with a cutoff of 12.57 rad/s c. Bandpass filter with a lower cutoff of 400 Hz and a higher cutoff 725 Hz d. Bandstop filter with a center frequency of 135.3 rad/s and a bandwidth of 84.74 rad/s
 7.3. Design a 5-tap FIR lowpass filter with a cutoff frequency of 100 Hz and a sampling rate of 1,000 Hz using a a. rectangular window function b. Hamming window function Determine the transfer function and difference equation of the designed FIR system, and compute and plot the magnitude frequency response for ?--0, ?/4, ?/2, 3r/4, and ? radians.
 The MATLAB program below designs a lowpass filter for a passband edge frequency of 250Hz and a stopband edge of 350Hz. The sampling frequency is 2kHz. A Hamming window is used. (a) The program is on Webcampus. Run it and copy and paste the wvtool plots into Word. % FIR Filter Design (using wvtool) % Lowpass Design clear fpass 250; fstop 350; fs 2000; wp 2*pi* fpass/ fs; ws 2* pi fstop / fs; M=ceil(6.6 * pi / (ws-wp)) +...
 2. (50 marks) Consider using the impulse invariance method to design a prototype IIR digital filter corresponding to the analogue prototype filter: He(s) = 52 +58 +6 a) Write the correct sequence of basic steps involved in this method. b) Determine the transfer function H(z) of the resulting digital filter. Simplify H(2) as much as possible. Assume a sampling frequency of fs = 100 HZ.
 Discrete Time Signal Processing Question 1. Consider an IIR filter A(1-2-1 cos ω0) 1-2cos ω02-1+2 I. Compute its impulse response using the difference equation with an impulse signal δ(n) as the input. Use trigonometric identities to simplify the result as much as you can 2. Draw the diagram showing the implementation of this filter in terms of adders, delays and multipliers Note: The IIR filter above generates a cosinusoidal signal when an impulse signal is applied at its input.] Question...
Most questions answered within 3 hours.
-
Considering gravitational time dilation, calculate the time that
passes in Earth’s surface while 1 hour passes...
asked 28 seconds from now -
Minitab Problem: Take the Lake Hume June rainfall data and find
use the processes outlined in...
asked 51 minutes ago -
X Company is trying to decide whether to continue using old
equipment to make Product A...
asked 53 minutes ago -
IN PYTHON ONLY !! Program 2: Re-work
program #5 (WeeklyHours) from the previous assignment such that...
asked 1 hour ago -
The average length of time between arrivals at a turnpike
toll-booth is 26 seconds. What is...
asked 3 hours ago -
(a) A piston at 6.1 atm contains a gas that occupies a volume of
3.5 L....
asked 4 hours ago -
Please answer true or false. Words
cannot be changed or added in to make it true...
asked 4 hours ago -
An empty test tube weighs 15.923 grams. Then,
MgCl2•6H2O is added into the test tube. After...
asked 4 hours ago -
Assume memory access is 10 units of time and disk access is
10000 units of time....
asked 4 hours ago -
1. Are all good samples random?
2. Magazines often report surveys giving statistics such as “63%...
asked 5 hours ago -
Under all the various types of market structures, firms
must eventually earn some economic profits for...
asked 4 hours ago -
Consider the following fitness regime for a single locus trait
with two co-dominant alleles: w11 =...
asked 4 hours ago