Required information [The following information applies to the questions displayed below.] Simon Company’s year-end balance sheets...
Required information
[The following information applies to the questions
displayed below.]
Simon Company’s year-end balance sheets follow.
| At December 31 | Current Yr | 1 Yr Ago | 2 Yrs Ago | ||||||||
| Assets | |||||||||||
| Cash | $ | 31,400 | $ | 35,250 | $ | 37,400 | |||||
| Accounts receivable, net | 89,500 | 63,000 | 50,500 | ||||||||
| Merchandise inventory | 111,500 | 80,400 | 54,000 | ||||||||
| Prepaid expenses | 10,400 | 9,200 | 5,400 | ||||||||
| Plant assets, net |
277,000 |
258,000 | 235,000 | ||||||||
| Total assets | $ | 519,800 | $ | 445,850 | $ | 382,300 | |||||
| Liabilities and Equity | |||||||||||
| Accounts payable | $ | 130,000 | $ | 76,000 | $ | 50,200 | |||||
| Long-term notes payable secured by mortgages on plant assets |
97,500 | 98,000 | 82,400 | ||||||||
| Common stock, $10 par value | 160,500 | 160,500 | 160,500 | ||||||||
| Retained earnings | 131,800 | 111,350 | 89,200 | ||||||||
| Total liabilities and equity | $ | 519,800 | $ | 445,850 | $ | 382,300 | |||||
The company’s income statements for the Current Year and 1 Year
Ago, follow.
| For Year Ended December 31 | Current Yr | 1 Yr Ago | ||||||||||
| Sales | $ | 725,000 | $ | 630,000 | ||||||||
| Cost of goods sold | $ | 435,000 | $ | 403,200 | ||||||||
| Other operating expenses | 224,750 | 157,500 | ||||||||||
| Interest expense | 11,200 | 12,600 | ||||||||||
| Income tax expense | 9,300 | 8,525 | ||||||||||
| Total costs and expenses | 680,250 | 581,825 | ||||||||||
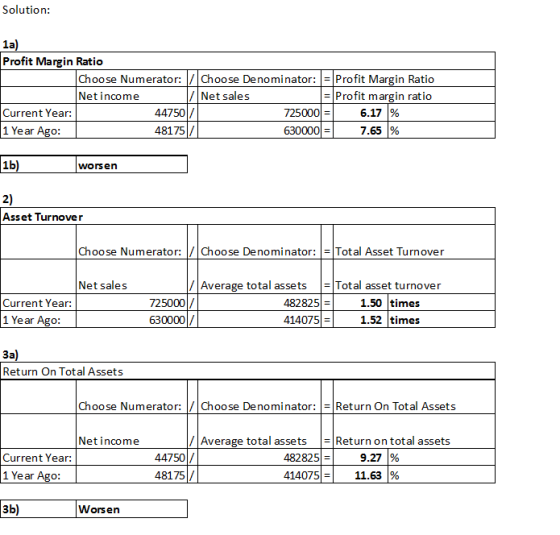
| Net income | $ | 44,750 | $ | 48,175 | ||||||||
| Earnings per share | $ | 2.79 | $ | 3.00 | ||||||||
(1-a) Profit margin ratio.
(1-b) Did profit margin improve or worsen in the
Current Year versus 1 Year Ago?
Profit margin ratio.
|
||||||||||||||||||||||||||||||||||||
Did profit margin improve or worsen in the Current Year versus 1 Year Ago?
|
(2) Total asset turnover.
|
||||||||||||||||||||||||||||||||||||
(3-a) Return on total assets.
(3-b) Based on return on total assets, did Simon's
operating efficiency improve or worsen in the Current Year versus 1
Year Ago?
Return on total assets
|
||||||||||||||||||||||||||||||||||||
Based on return on total assets, did Simon's operating efficiency improve or worsen in the Current Year versus 1 Year Ago?
|
Homework Answers
Add Answer to:
Required information
[The following information applies to the questions
displayed below.]
Simon Company’s year-end balance sheets...
Required information (The following information applies to the questions displayed below.] Simon Company's year-end balance sheets...
 Required information (The following information applies to the questions displayed below.] Simon Company's year-end balance sheets follow. Current yr 1 Yr Ago 2 Yrs Ago At December 31 Assets Cash Accounts receivable, net Merchandise inventory Prepaid expenses Plant assets, net Total assets Liabilities and Equity Accounts payable Long-term notes payable secured by mortgages on plant assets Common stock, $10 par value Retained earnings Total liabilities and equity $ 30,000 87,700 112,500 10,800 280,000 $521,000 $ 35,250 $ 37,400 62,000 49,500...
Required Information The following information applies to the questions displayed below.] Simon Company's year-end balance sheets...
 Required Information The following information applies to the questions displayed below.] Simon Company's year-end balance sheets follow. Current Yr 1 Yr Ago 2 Yrs Ago At December 31 Assets $ 3.80 88, see 118, see 10,55€ 279,20 $519,650 $ 36, $ 37,620 62, 49, see 84, ese 54, Bee 9,450 5 , 480 251,000 228, 22 $442,450 $ 374,500 Accounts receivable, net Merchandise inventory Prepaid cxpenses plant assets, net Total assets Liabilities and Equity Accounts payable Long-term notes payable secured...
Required information [The following information applies to the questions displayed below.) Simon Company's year-end balance sheets...
 Required information [The following information applies to the questions displayed below.) Simon Company's year-end balance sheets follow. Current Yr 1 Yr Ago 2 Yrs Ago $ 31,000 87,300 110,500 10,950 279,000 At December 31 Assets Cash Accounts receivable, net Merchandise inventory Prepaid expenses Plant assets, net Total assets Liabilities and Equity Accounts payable Long-term notes payable secured by mortgages on plant assets Common stock, $10 par value Retained earnings Total liabilities and equity $ 35,750 $ 38,600 63,500 49,500 82,400...
Simon Company’s year-end balance sheets follow. At December 31 Current Yr 1 Yr Ago 2 Yrs...
Simon Company’s year-end balance sheets follow. At December 31 Current Yr 1 Yr Ago 2 Yrs Ago Assets Cash $ 32,200 $ 35,750 $ 38,200 Accounts receivable, net 88,700 63,000 50,500 Merchandise inventory 111,500 81,400 53,500 Prepaid expenses 11,000 9,450 5,100 Plant assets, net 281,000 251,500 234,000 Total assets $ 524,400 $ 441,100 $ 381,300 Liabilities and Equity Accounts payable $ 129,600 $ 75,750 $ 50,200 Long-term notes payable secured by mortgages on plant assets 97,500 100,000 83,000 Common stock,...
Required information [The following information applies to the questions displayed below.] Simon Company’s year-end balance sheets...
Required information [The following information applies to the questions displayed below.] Simon Company’s year-end balance sheets follow. At December 31 Current Yr 1 Yr Ago 2 Yrs Ago Assets Cash $ 32,935 $ 38,498 $ 38,545 Accounts receivable, net 89,200 62,800 51,100 Merchandise inventory 114,000 85,000 51,000 Prepaid expenses 10,606 10,106 4,283 Plant assets, net 295,220 270,804 233,072 Total assets $ 541,961 $ 467,208 $ 378,000 Liabilities and Equity Accounts payable $ 138,997 $ 81,327 $ 51,393 Long-term notes payable...
Simon Company’s year-end balance sheets follow. At December 31 Current Yr 1 Yr Ago 2 Yrs...
Simon Company’s year-end balance sheets follow. At December 31 Current Yr 1 Yr Ago 2 Yrs Ago Assets Cash $ 32,935 $ 38,498 $ 38,545 Accounts receivable, net 89,200 62,800 51,100 Merchandise inventory 114,000 85,000 51,000 Prepaid expenses 10,606 10,106 4,283 Plant assets, net 295,220 270,804 233,072 Total assets $ 541,961 $ 467,208 $ 378,000 Liabilities and Equity Accounts payable $ 138,997 $ 81,327 $ 51,393 Long-term notes payable secured by mortgages on plant assets 104,945 110,682 86,044 Common stock,...
Required information [The following information applies to the questions displayed below.] Simon Company’s year-end balance sheets...
Required information [The following information applies to the questions displayed below.] Simon Company’s year-end balance sheets follow. At December 31 Current Yr 1 Yr Ago 2 Yrs Ago Assets Cash $ 36,426 $ 41,743 $ 43,048 Accounts receivable, net 101,432 73,781 55,709 Merchandise inventory 132,737 94,601 59,324 Prepaid expenses 11,615 10,958 4,736 Plant assets, net 323,068 300,708 263,483 Total assets $ 605,278 $ 521,791 $ 426,300 Liabilities and Equity Accounts payable $ 153,729 $ 88,183 $ 57,960 Long-term notes payable...
Required information [The following information applies to the questions displayed below.) Simon Company's year-end balance sheets...
 Required information [The following information applies to the questions displayed below.) Simon Company's year-end balance sheets follow. Current Yr1 Yr Ago 2 Yrs Ago At December 31 Assets Cash Accounts receivable, net Merchandise inventory Prepaid expenses Plant assets, net Total assets Liabilities and Equity Accounts payable Long-term notes payable secured by mortgages on plant assets Common stock, $10 par value Retained earnings Total liabilities and equity $ 23,741 69,512 86,515 7,802 223,038 $410,608 $ 27,751 $ 29,805 49,556 39, 338...
Simon Company’s year-end balance sheets follow. At December 31 Current Yr 1 Yr Ago 2 Yrs...
Simon Company’s year-end balance sheets follow. At December 31 Current Yr 1 Yr Ago 2 Yrs Ago Assets Cash $ 31,800 $ 35,625 $ 37,800 Accounts receivable, net 89,500 62,500 50,200 Merchandise inventory 112,500 82,500 54,000 Prepaid expenses 10,700 9,375 5,000 Plant assets, net 278,500 255,000 230,500 Total assets $ 523,000 $ 445,000 $ 377,500 Liabilities and Equity Accounts payable $ 129,900 $ 75,250 $ 51,250 Long-term notes payable secured by mortgages on plant assets 98,500 101,500 83,500 Common stock,...
Simon Company’s year-end balance sheets follow. At December 31 Current Yr 1 Yr Ago 2 Yrs...
Simon Company’s year-end balance sheets follow. At December 31 Current Yr 1 Yr Ago 2 Yrs Ago Assets Cash $ 32,294 $ 38,893 $ 38,527 Accounts receivable, net 93,598 67,395 53,488 Merchandise inventory 117,682 87,294 55,831 Prepaid expenses 10,295 10,009 4,369 Plant assets, net 299,017 273,035 248,985 Total assets $ 552,886 $ 476,626 $ 401,200 Liabilities and Equity Accounts payable $ 136,292 $ 78,133 $ 51,899 Long-term notes payable secured by mortgages on plant assets 100,824 107,432 87,779 Common stock,...
 Required information (The following information applies to the questions displayed below.] Simon Company's year-end balance sheets follow. Current yr 1 Yr Ago 2 Yrs Ago At December 31 Assets Cash Accounts receivable, net Merchandise inventory Prepaid expenses Plant assets, net Total assets Liabilities and Equity Accounts payable Long-term notes payable secured by mortgages on plant assets Common stock, $10 par value Retained earnings Total liabilities and equity $ 30,000 87,700 112,500 10,800 280,000 $521,000 $ 35,250 $ 37,400 62,000 49,500...
 Required Information The following information applies to the questions displayed below.] Simon Company's year-end balance sheets follow. Current Yr 1 Yr Ago 2 Yrs Ago At December 31 Assets $ 3.80 88, see 118, see 10,55€ 279,20 $519,650 $ 36, $ 37,620 62, 49, see 84, ese 54, Bee 9,450 5 , 480 251,000 228, 22 $442,450 $ 374,500 Accounts receivable, net Merchandise inventory Prepaid cxpenses plant assets, net Total assets Liabilities and Equity Accounts payable Long-term notes payable secured...
 Required information [The following information applies to the questions displayed below.) Simon Company's year-end balance sheets follow. Current Yr 1 Yr Ago 2 Yrs Ago $ 31,000 87,300 110,500 10,950 279,000 At December 31 Assets Cash Accounts receivable, net Merchandise inventory Prepaid expenses Plant assets, net Total assets Liabilities and Equity Accounts payable Long-term notes payable secured by mortgages on plant assets Common stock, $10 par value Retained earnings Total liabilities and equity $ 35,750 $ 38,600 63,500 49,500 82,400...
 Required information [The following information applies to the questions displayed below.) Simon Company's year-end balance sheets follow. Current Yr1 Yr Ago 2 Yrs Ago At December 31 Assets Cash Accounts receivable, net Merchandise inventory Prepaid expenses Plant assets, net Total assets Liabilities and Equity Accounts payable Long-term notes payable secured by mortgages on plant assets Common stock, $10 par value Retained earnings Total liabilities and equity $ 23,741 69,512 86,515 7,802 223,038 $410,608 $ 27,751 $ 29,805 49,556 39, 338...
Most questions answered within 3 hours.
-
4. How many input & output Key Value Pairs are passed into,
and emitted out of...
asked 18 minutes ago -
B. If compound Y has approximately the same values of solubility
in toluene as compound X,...
asked 7 minutes ago -
Oscar Inc. has inventory in Japan valued at 39,051,000 Yen one
year ago. One year ago...
asked 14 minutes ago -
If Canada suffered from "fundamental disequilibrium," and its
government choose not to devalue its currency, a...
asked 22 minutes ago -
Why would your heart not function well if constructed of
skeletal muscle? What is the particular...
asked 26 minutes ago -
Please respond to this essay question in full essay form for
Chemistry 1102 Organic and Biochemistry:...
asked 27 minutes ago -
Determine the head loss and velocity of flow in a water supply main
of 15.0 cm...
asked 29 minutes ago -
A marketing executive who knowingly authorizes a shoddy
defective product to be brought to market is...
asked 37 minutes ago -
Write a psudocode:
1. Define a function called authorize that takes in 2 strings,
uName, and...
asked 42 minutes ago -
What Hall voltage (in mV) is produced by a 0.180 T field applied
across a 2.60...
asked 41 minutes ago -
What mass of ethylene glycol (C2H6O2) must be added to 211.0 g
of water to obtain...
asked 44 minutes ago -
Mary's employer has a defined benefits retirement plan, which
pay 3.2% of her last year's salary...
asked 47 minutes ago