Enrollment in a particular class for the last six semesters had been 20, 30, 50, 40,...
Enrollment in a particular class for the last six semesters had been 20, 30, 50, 40, 80 and 60. Develop a forecast of enrollment next semester using exponential smoothing with an alpha = 0.2 and use the naive method to start the exponential smoothing process (i.e., forecast for semester 2 = 20).
Homework Answers
Solution:
In exponential smoothing,
F(t+1) =  A(t) + (1-)F(t)
where,
F(t+1) = Forecast for the next period
A(t) = Actual demand for the current period
F(t) = Forecast for the current period
= Smoothing constant
= 0.2
(1-) = 0.8
The forecast of enrollment next semester using exponential smoothing is calculated in the table below:
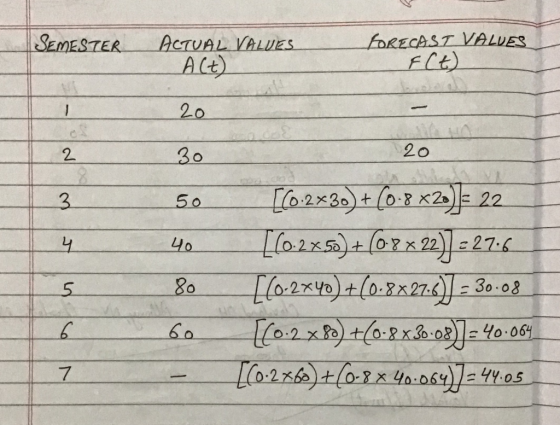

From the above calculations, Forecast for 7th semester = 44.05
Add Answer to:
Enrollment in a particular class for the last six semesters had
been 20, 30, 50, 40,...
Q1. Enrollment in a particular class for the last semester has been 127 develop a forecast...
Q1. Enrollment in a particular class for the last semester has been 127 develop a forecast of enrollment next semester using exponential smoothing with an alpha = 0.5 assume that an initial forecast for the last semester was 148.
)Enrollment in a particular class for the last four semesters has been 120, 126, 110, and...
 )Enrollment in a particular class for the last four semesters has been 120, 126, 110, and 130 semester moving average was used to forecast enrollment (this is sometimes refered to as a naive Thus, the forecast for the second semester it would be 110. What would the MSE be for this situation? reg 2) Enrollment in a particular class for the last four semesters has been 122.128, 100, and 153 listed from oldest to most recent). The best forecast of...
Enrollment in a particular class for the last four semesters has been 122, 128, 101, and...
Enrollment in a particular class for the last four semesters has been 122, 128, 101, and 155 (listed from oldest to most recent). The best forecast of enrollment next semester, based on a three-semester moving average, would be
The following data are monthly sales of jeans at a local department store.
 4. The following data are monthly sales of jeans at a local department store. The buyer would like to forecast sales of jeans for the next month, July. (a) Forecast sales of jeans for March through June using the naive method, a two-period moving average, and exponential smoothing with an a = 0.2. (Hint: Use naive to start the exponential smoothing process.) (b) Compare the forecasts using MAD and decide which is best. (c) Using your method of choice, make a forecast for...
TEST, I need Help A.S.A.P PLease!!! I need to submit this within the next hour and a half. It's...
1. Regression is always a superior forecasting method to exponential smoothing, so regression should be used whenever the appropriate software is available. (Points :1)TrueFalse2. Time-series models rely on judgment in an attempt to incorporate qualitative or subjective factors into the forecasting model. (Points : 1)TrueFalse3. A trend-projection forecasting method is a causal forecasting method. (Points : 1)TrueFalse4. Qualitative models attempt to incorporate judgmental or subjective factors into the forecasting model. (Points : 1)TrueFalse5. The naive forecast for the next period...
The following payoff table provides profits based on various possible decision alternatives and various levels of...
The following payoff table provides profits based on various possible decision alternatives and various levels of demand with probabilities of different demands: States of Nature Demand Alternatives Low Medium High Alternative A 80 120 140 Alternative B 70 90 100 Alternative C 30 60 120 Probability 0.4 0.3 0.3 What will be the expected value of perfect information (EVPI) for this situation? 2. Given the following gasoline data: Quarter Year 1 Year 2 1 95 105 2 85 95 3...
9:14 NAME: Please show work. following forecast models, what can be donc? Simple moving average: Naive...
 9:14 NAME: Please show work. following forecast models, what can be donc? Simple moving average: Naive method: 2. While monitoring the forecast values, the tracking signals are consistently coming out as large negative numbers (ie 3.5,-5.9,-7.8) What does this mean? s Given the actual data as below, what is the forecast for period 6, using a four-period weighted moving average with weights of.1,2,3 and 4 (greater weight towards more recent time)? Show work 4. Actual demand for the last four...
Quantitative Methods (STAT-201) Q3 . A manager is deciding whether or not to build a small...
Quantitative Methods (STAT-201) Q3 . A manager is deciding whether or not to build a small facility. Demand is uncertain and can be either at a high or low level. If the manager chooses a small facility and demand is low, the payoff is $30. If the manager chooses a small facility and demand is high, the payoff is $10. On the other hand, if the manager chooses a large facility and demand is low, the payoff is -$20, but...
Examples 1,2,3 1. Beyond Tea Inc. wants to forecast sales of its menthol green tea. The...
 Examples 1,2,3
1. Beyond Tea Inc. wants to forecast sales of its menthol green
tea. The company is considering either using a simple mean or a
three-period moving average to forecast monthly sales. Given sales
data for the past 10 months use both forecasting methods to
forecast periods 7 to 10 and then evaluate each. Which method
should they use? Use the selected method to make a forecast for
month 11. (Show all calculations .... Please read Examples1, 2, 3...
Examples 1,2,3
1. Beyond Tea Inc. wants to forecast sales of its menthol green
tea. The company is considering either using a simple mean or a
three-period moving average to forecast monthly sales. Given sales
data for the past 10 months use both forecasting methods to
forecast periods 7 to 10 and then evaluate each. Which method
should they use? Use the selected method to make a forecast for
month 11. (Show all calculations .... Please read Examples1, 2, 3...
Masters Level work....all work must be shown. FORECASTING Forecasting ASSIgnment 1. Given the following data, use...
 Masters Level work....all work must be shown. FORECASTING
Forecasting ASSIgnment 1. Given the following data, use a three-quarter moving average to forecast the demand for the third quarter of this year. Note, the first quarter is January, February, and March; the second quarter is April, May, and June; the third quarter is July, August, September, and the 4° quarter is October, November, and December ul ct 50 This year 235 245 255 295 305 295 Answer (Please show your work...
Masters Level work....all work must be shown. FORECASTING
Forecasting ASSIgnment 1. Given the following data, use a three-quarter moving average to forecast the demand for the third quarter of this year. Note, the first quarter is January, February, and March; the second quarter is April, May, and June; the third quarter is July, August, September, and the 4° quarter is October, November, and December ul ct 50 This year 235 245 255 295 305 295 Answer (Please show your work...
 )Enrollment in a particular class for the last four semesters has been 120, 126, 110, and 130 semester moving average was used to forecast enrollment (this is sometimes refered to as a naive Thus, the forecast for the second semester it would be 110. What would the MSE be for this situation? reg 2) Enrollment in a particular class for the last four semesters has been 122.128, 100, and 153 listed from oldest to most recent). The best forecast of...
 9:14 NAME: Please show work. following forecast models, what can be donc? Simple moving average: Naive method: 2. While monitoring the forecast values, the tracking signals are consistently coming out as large negative numbers (ie 3.5,-5.9,-7.8) What does this mean? s Given the actual data as below, what is the forecast for period 6, using a four-period weighted moving average with weights of.1,2,3 and 4 (greater weight towards more recent time)? Show work 4. Actual demand for the last four...
 Examples 1,2,3
1. Beyond Tea Inc. wants to forecast sales of its menthol green
tea. The company is considering either using a simple mean or a
three-period moving average to forecast monthly sales. Given sales
data for the past 10 months use both forecasting methods to
forecast periods 7 to 10 and then evaluate each. Which method
should they use? Use the selected method to make a forecast for
month 11. (Show all calculations .... Please read Examples1, 2, 3...
Examples 1,2,3
1. Beyond Tea Inc. wants to forecast sales of its menthol green
tea. The company is considering either using a simple mean or a
three-period moving average to forecast monthly sales. Given sales
data for the past 10 months use both forecasting methods to
forecast periods 7 to 10 and then evaluate each. Which method
should they use? Use the selected method to make a forecast for
month 11. (Show all calculations .... Please read Examples1, 2, 3...
 Masters Level work....all work must be shown. FORECASTING
Forecasting ASSIgnment 1. Given the following data, use a three-quarter moving average to forecast the demand for the third quarter of this year. Note, the first quarter is January, February, and March; the second quarter is April, May, and June; the third quarter is July, August, September, and the 4° quarter is October, November, and December ul ct 50 This year 235 245 255 295 305 295 Answer (Please show your work...
Masters Level work....all work must be shown. FORECASTING
Forecasting ASSIgnment 1. Given the following data, use a three-quarter moving average to forecast the demand for the third quarter of this year. Note, the first quarter is January, February, and March; the second quarter is April, May, and June; the third quarter is July, August, September, and the 4° quarter is October, November, and December ul ct 50 This year 235 245 255 295 305 295 Answer (Please show your work...
Most questions answered within 3 hours.
-
How many liters of 0.669 M KOH will be needed to raise the pH of
0.339...
asked 35 minutes ago -
A liquid of density 1270 kg/m 3 flows steadily through a pipe of
varying diameter and...
asked 52 minutes ago -
Questions: What should the American executive do?
'A visiting American executive finds that a foreign subsidiary...
asked 43 minutes ago -
Activity based costing was introduced as an alternative to
absorption costing.
1. Discuss using illustration the...
asked 46 minutes ago -
1. You own shares of Crane DVD Company and are interested in
selling them. With so...
asked 50 minutes ago -
How many grams of He are necessary to fill a balloon having a
volume of 4.5E3...
asked 51 minutes ago -
The 2 patients, still in the hospital, were interviewed by a
MoH epidemiologist. The interviews revealed...
asked 55 minutes ago -
An uncharged capacitor and a resistor are connected in series to
a source of emf. If...
asked 1 hour ago -
If assets are $540,000 and liabilities are $236,000 what is the
amount of owner’s equity?
asked 1 hour ago -
MATH 3421 Maple Assignment 1 Due February 13, 2019 Maple is a
Computer Algebra System that...
asked 1 hour ago -
CODING IN JAVA
Dates are printed in several common formats. Two of the more
common formats...
asked 1 hour ago -
A hydrometer is a device used to measure the density of a
liquid. It is a...
asked 1 hour ago