Problem 08-06 Algo (Moving Averages and Exponential Smoothing)
Consider the following time series data:
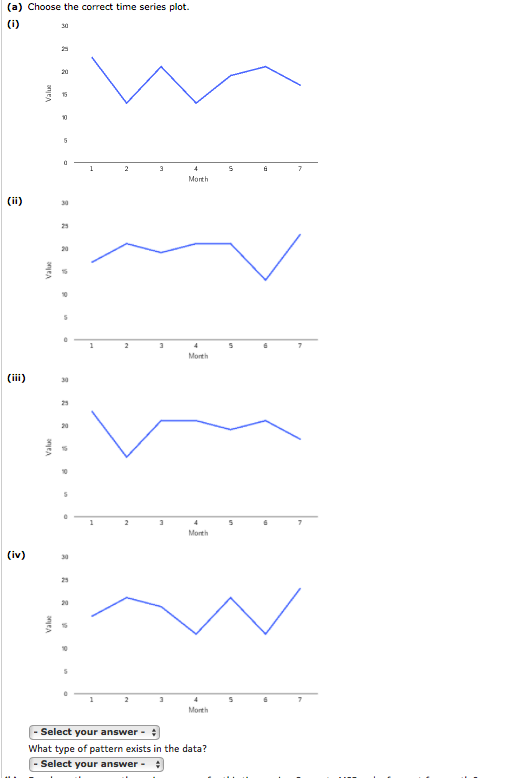
| Month | 1 | 2 | 3 | 4 | 5 | 6 | 7 |
| Value | 23 | 13 | 21 | 13 | 19 | 21 | 17 |
Homework Answers
q(a) The correct time series plot is (i) (YOU CAN SEE THE INTERSECTION OF BOTH THE VALUES AND THE FIRST GRAPH IS APPROPRIATE ACCORDING TO THE VALUES).
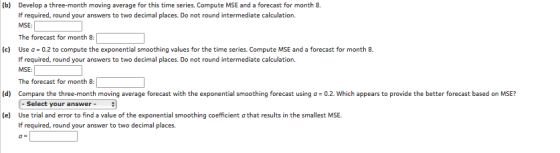
(b)
| Months | Value |
3-month moving average Forecast |
Absolute Value of Forecast Error | Squared Forecast Error |
| 1 | 23 | - | - | - |
| 2 | 13 | |||
| 3 | 21 | |||
| 4 | 13 | 19 |  |
36 |
| 5 | 19 | 15.67 |  |
11.0889 |
| 6 | 21 | 17.67 |  |
11.0889 |
| 7 | 17 | 17.67 |  |
0.4489 |
Forecast for 8th month = 

MSE = 
(c) Calculate  forecast
using this formula
St=αyt−1+(1−α)St−1
forecast
using this formula
St=αyt−1+(1−α)St−1
| Months |
Value (Yt) |
Forecast (St) |
Absolute Value of Forecast Error | Squared Forecast Error |
| 1 | 23 | - | - | - |
| 2 | 13 | 23 |  |
100 |
| 3 | 21 | 21 | 0 | 0 |
| 4 | 13 | 21 |  |
64 |
| 5 | 19 | 19.4 |  |
0.16 |
| 6 | 21 | 19.32 |  |
2.8224 |
| 7 | 17 | 17.67 | |
0.4489 |
Forecast for month 8 = 0.2(17)+(1-0.2)(17.67) = 17.536
MSE = 
= 27.90
(d) The three month moving average MSE is better as it is less than the exponential smoothing forecast.
(e) Let MSE = 0.1 then,
| Months |
Value (Yt) |
Forecast (St) |
Absolute Value of Forecast Error | Squared Forecast Error |
| 1 | 23 | - | - | - |
| 2 | 13 | 23 | |
100 |
| 3 | 21 | 22 |  |
1 |
| 4 | 13 | 21.9 |  |
79.21 |
| 5 | 19 | 21.01 |  |
4.0401 |
| 6 | 21 | 20.809 |  |
0.036481 |
| 7 | 17 | 20.8281 | |
0.4489 |
MSE = 30.12
MSE with alpha = 0.2 is the smallest MSE.
Add Answer to:
Problem 08-06 Algo (Moving Averages and Exponential
Smoothing)
Consider the following time series data:
Month
1...
Consider the following time series data: Month 1 2 3 4 5 6 7 Value 24...
Consider the following time series data: Month 1 2 3 4 5 6 7 Value 24 13 21 14 20 23 15 (c) Use α = 0.2 to compute the exponential smoothing values for the time series. Compute MSE and a forecast for month 8. If required, round your answers to two decimal places. Do not round intermediate calculation. MSE: The forecast for month 8: (e) Use trial and error to find a value of the exponential smoothing coefficient α...
Please help Consider the following time series data. Week 1 N 3 4 5 6 Value...
 Please help
Consider the following time series data. Week 1 N 3 4 5 6 Value 19 11 13 10 14 12 (a) Construct a time series plot. 20 18 20 18 14 12 10 Week 3 4 Week D 20 18+ 16 Time Series Value Time Series Value 5 Week 0 Wook What type of pattem exists in the data? The data appear to follow a cyclical pattern. The data appear to follow a trend pattem. The data appear...
Please help
Consider the following time series data. Week 1 N 3 4 5 6 Value 19 11 13 10 14 12 (a) Construct a time series plot. 20 18 20 18 14 12 10 Week 3 4 Week D 20 18+ 16 Time Series Value Time Series Value 5 Week 0 Wook What type of pattem exists in the data? The data appear to follow a cyclical pattern. The data appear to follow a trend pattem. The data appear...
Omework Consider the following time series data Month 1 2 3 4 5 6 7 Value 21 14 18 13 18 21 14 a....
 omework Consider the following time series data Month 1 2 3 4 5 6 7 Value 21 14 18 13 18 21 14 a. Which of the following is a correct time series plot for this data? や" -Select your answer- What type of pattern exists in the data? -select your answer- b. Develop the three-month moving average forecasts for this time series. Compute MSE and a forecast for month 8 (to 2 decimals if necessary). Enter negative values as...
Consider the following time series data. Week 1 2 3 4 5 6 Value 17 13...
 Consider the following time series data.
Week
1
2
3
4
5
6
Value
17
13
15
11
15
13
(a)
Choose the correct time series plot.
(i)
(ii)
(iii)
(iv)
- Select your answer -Graph (i)Graph (ii)Graph (iii)Graph
(iv)Item 1
What type of pattern exists in the data?
- Select your answer -Horizontal PatternTrend PatternItem
2
(b)
Develop a three-week moving average for this time series.
Compute MSE and a forecast for week 7.
If required, round your answers...
Consider the following time series data.
Week
1
2
3
4
5
6
Value
17
13
15
11
15
13
(a)
Choose the correct time series plot.
(i)
(ii)
(iii)
(iv)
- Select your answer -Graph (i)Graph (ii)Graph (iii)Graph
(iv)Item 1
What type of pattern exists in the data?
- Select your answer -Horizontal PatternTrend PatternItem
2
(b)
Develop a three-week moving average for this time series.
Compute MSE and a forecast for week 7.
If required, round your answers...
Consider the following time series data. Week 1 2 3 4 5 6 Value 19 11 16 1017 15 (a) Construct a ...
 Consider the following time series data. Week 1 2 3 4 5 6 Value 19 11 16 1017 15 (a) Construct a time series plot. 20 20 20 18 16 14 12 10 c 14 12 12 0 23 4 5 67 0 23 4 5 67 Week Weck Week 20 18 0 1 2345 6 7 Week What type of pattern exists in the data? The data appear to follow a seasonal pattern. The data appear to follow a...
Consider the following time series data. Week 1 2 3 4 5 6 Value 19 14...
Consider the following time series data. Week 1 2 3 4 5 6 Value 19 14 17 12 17 14 Develop a three-week moving average for this time series. Compute MSE and a forecast for week 7. Round your answers to two decimal places. Week Time Series Value Forecast 1 19 2 14 3 17 4 12 5 17 6 14 MSE: The forecast for week 7: Use = 0.2 to compute the exponential smoothing values for the time series....
Use α = 0.2 to compute the exponential smoothing values for the time series. Compute MSE...
 Use α = 0.2 to compute the exponential smoothing values for the time series. Compute MSE and a forecast for week 7. If required, round your answers to two decimal places. What am i doing wrong in this problem?
Consider the following time series data.
 Please help :) a. Which of the following is a correct time series plot for this data? b. Develop the three-month moving average forecasts for this time series. Compute MSE and a forecast for month 8 (to 2 decimals if necessary). c. Use α-.2 to compute the exponential smoothing forecasts for the time series. Compute MSE and a forecast for month 8 (to 2 decimals). Enter negative values as negative number. d. Compare the three-month moving average approach with the exponential smoothing approach using...
Consider the following time series data: Month 1 2 3 4 5 6 7 Value 23...
Consider the following time series data: Month 1 2 3 4 5 6 7 Value 23 13 19 13 19 24 15 (a) Compute MSE using the most recent value as the forecast for the next period. If required, round your answer to one decimal place. What is the forecast for month 8? If required, round your answer to one decimal place. Do not round intermediate calculation. (b) Compute MSE using the average of all the data available as the...
Consider the following time series data. Week 1 2 3 4 5 6 Value 19 13 16 12 18 14 a. Whic...
Consider the following time series data. Week 1 2 3 4 5 6 Value 19 13 16 12 18 14 a. Which of the following is a correct time series plot for this data? - Select your answer -plot #1plot #2plot #3Item 1 What type of pattern exists in the data? - Select your answer -VerticalHorizontalScatterItem 2 b. Develop the three-week moving average forecasts for this time series. Compute MSE and a forecast for week (to 2 decimals if necessary)....
 Please help
Consider the following time series data. Week 1 N 3 4 5 6 Value 19 11 13 10 14 12 (a) Construct a time series plot. 20 18 20 18 14 12 10 Week 3 4 Week D 20 18+ 16 Time Series Value Time Series Value 5 Week 0 Wook What type of pattem exists in the data? The data appear to follow a cyclical pattern. The data appear to follow a trend pattem. The data appear...
Please help
Consider the following time series data. Week 1 N 3 4 5 6 Value 19 11 13 10 14 12 (a) Construct a time series plot. 20 18 20 18 14 12 10 Week 3 4 Week D 20 18+ 16 Time Series Value Time Series Value 5 Week 0 Wook What type of pattem exists in the data? The data appear to follow a cyclical pattern. The data appear to follow a trend pattem. The data appear...
 omework Consider the following time series data Month 1 2 3 4 5 6 7 Value 21 14 18 13 18 21 14 a. Which of the following is a correct time series plot for this data? や" -Select your answer- What type of pattern exists in the data? -select your answer- b. Develop the three-month moving average forecasts for this time series. Compute MSE and a forecast for month 8 (to 2 decimals if necessary). Enter negative values as...
 Consider the following time series data.
Week
1
2
3
4
5
6
Value
17
13
15
11
15
13
(a)
Choose the correct time series plot.
(i)
(ii)
(iii)
(iv)
- Select your answer -Graph (i)Graph (ii)Graph (iii)Graph
(iv)Item 1
What type of pattern exists in the data?
- Select your answer -Horizontal PatternTrend PatternItem
2
(b)
Develop a three-week moving average for this time series.
Compute MSE and a forecast for week 7.
If required, round your answers...
Consider the following time series data.
Week
1
2
3
4
5
6
Value
17
13
15
11
15
13
(a)
Choose the correct time series plot.
(i)
(ii)
(iii)
(iv)
- Select your answer -Graph (i)Graph (ii)Graph (iii)Graph
(iv)Item 1
What type of pattern exists in the data?
- Select your answer -Horizontal PatternTrend PatternItem
2
(b)
Develop a three-week moving average for this time series.
Compute MSE and a forecast for week 7.
If required, round your answers...
 Consider the following time series data. Week 1 2 3 4 5 6 Value 19 11 16 1017 15 (a) Construct a time series plot. 20 20 20 18 16 14 12 10 c 14 12 12 0 23 4 5 67 0 23 4 5 67 Week Weck Week 20 18 0 1 2345 6 7 Week What type of pattern exists in the data? The data appear to follow a seasonal pattern. The data appear to follow a...
 Use α = 0.2 to compute the exponential smoothing values for the time series. Compute MSE and a forecast for week 7. If required, round your answers to two decimal places. What am i doing wrong in this problem?
 Please help :) a. Which of the following is a correct time series plot for this data? b. Develop the three-month moving average forecasts for this time series. Compute MSE and a forecast for month 8 (to 2 decimals if necessary). c. Use α-.2 to compute the exponential smoothing forecasts for the time series. Compute MSE and a forecast for month 8 (to 2 decimals). Enter negative values as negative number. d. Compare the three-month moving average approach with the exponential smoothing approach using...
Most questions answered within 3 hours.
-
The Maxit Corporation has a standard costing system in which
variable manufacturing overhead is assigned to...
asked 4 minutes ago -
Let M = 8.00kg, m = 6.00kg, θ = 40.00, and the coefficient of
kinetic friction...
asked 21 minutes ago -
Java. For C through H True or false?
c. Primitive variables must be objects.
d. Integer...
asked 26 minutes ago -
Write a program that turns a 32-bit numeric value (e.g.,
0xFFFFh) and converts it to a...
asked 28 minutes ago -
A motor produces a torque of 0.25 N m at an angular velocity of
7200 revolutions...
asked 41 minutes ago -
***Please answer the below java question***
Are static methods inheritable? Can they be overridden?
asked 44 minutes ago -
In reaching her destination, a backpacker walks with an average
velocity of 1.13 m/s, due west....
asked 44 minutes ago -
Write two C programs that run a
server program and a client program concurrently.
Server program:...
asked 43 minutes ago -
Executive Program Practical Connection Assignment
Subject : Operations Security.
Assignment:
Provide a reflection of at least...
asked 53 minutes ago -
Every time Casey is at bat he has a 0.4 probability of
getting on base (assume...
asked 1 hour ago -
The Walston Company is to be liquidated and has the following
liabilities:
Income taxes
$
9,400...
asked 1 hour ago -
If
the more comprehensive data is available in MEPS, why does the NHIS
still exist? How...
asked 1 hour ago