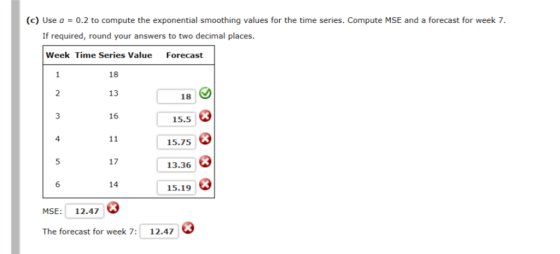
Use α = 0.2 to compute the exponential smoothing values for the time series. Compute MSE and a forecast for week 7. If required, round your answers to two decimal places. What am i doing wrong in this problem?
Homework Answers
According to the given information , if  , the
exponential smoothing time series is determined as:
, the
exponential smoothing time series is determined as:

Forecast value of different week are as follows:


Therefore forecast value of 7th week is determined as:


|
Week |
Time Series Value
|
Forecast
|
Error
|
 |
|
1 |
18 |
- |
||
|
2 |
13 |
18 |
-5 |
25 |
|
3 |
16 |
17 |
-1 |
1 |
|
4 |
11 |
16.8 |
-5.8 |
33.64 |
|
5 |
17 |
15.64 |
1.36 |
1.8496 |
|
6 |
14 |
15.912 |
-1.912 |
3.655744 |
|
7 |
15.5296 |
65.14534 |


Now the mean square error is determined as:

Therefore the

Add Answer to:
Use α = 0.2 to compute the exponential smoothing values for the time series. Compute MSE...
Problem 08-06 Algo (Moving Averages and Exponential Smoothing) Consider the following time series data: Month 1...
 Problem 08-06 Algo (Moving Averages and Exponential
Smoothing)
Consider the following time series data:
Month
1
2
3
4
5
6
7
Value
23
13
21
13
19
21
17
(a) Choose the correct time series plot Month (iv) Month Select your answer What type of pattern exists in the data? Select your answer- (b) Develop a three-month moving average for this time series. Compute MSE and a forecast for month 8. If required, round your answers to two decimal...
Problem 08-06 Algo (Moving Averages and Exponential
Smoothing)
Consider the following time series data:
Month
1
2
3
4
5
6
7
Value
23
13
21
13
19
21
17
(a) Choose the correct time series plot Month (iv) Month Select your answer What type of pattern exists in the data? Select your answer- (b) Develop a three-month moving average for this time series. Compute MSE and a forecast for month 8. If required, round your answers to two decimal...
Consider the following time series data. Week 1 2 3 4 5 6 Value 17 13...
 Consider the following time series data.
Week
1
2
3
4
5
6
Value
17
13
15
11
15
13
(a)
Choose the correct time series plot.
(i)
(ii)
(iii)
(iv)
- Select your answer -Graph (i)Graph (ii)Graph (iii)Graph
(iv)Item 1
What type of pattern exists in the data?
- Select your answer -Horizontal PatternTrend PatternItem
2
(b)
Develop a three-week moving average for this time series.
Compute MSE and a forecast for week 7.
If required, round your answers...
Consider the following time series data.
Week
1
2
3
4
5
6
Value
17
13
15
11
15
13
(a)
Choose the correct time series plot.
(i)
(ii)
(iii)
(iv)
- Select your answer -Graph (i)Graph (ii)Graph (iii)Graph
(iv)Item 1
What type of pattern exists in the data?
- Select your answer -Horizontal PatternTrend PatternItem
2
(b)
Develop a three-week moving average for this time series.
Compute MSE and a forecast for week 7.
If required, round your answers...
Consider the following time series data. Week 1 2 3 4 5 6 Value 19 11 16 1017 15 (a) Construct a ...
 Consider the following time series data. Week 1 2 3 4 5 6 Value 19 11 16 1017 15 (a) Construct a time series plot. 20 20 20 18 16 14 12 10 c 14 12 12 0 23 4 5 67 0 23 4 5 67 Week Weck Week 20 18 0 1 2345 6 7 Week What type of pattern exists in the data? The data appear to follow a seasonal pattern. The data appear to follow a...
Consider the following time series data: Month 1 2 3 4 5 6 7 Value 24...
Consider the following time series data: Month 1 2 3 4 5 6 7 Value 24 13 21 14 20 23 15 (c) Use α = 0.2 to compute the exponential smoothing values for the time series. Compute MSE and a forecast for month 8. If required, round your answers to two decimal places. Do not round intermediate calculation. MSE: The forecast for month 8: (e) Use trial and error to find a value of the exponential smoothing coefficient α...
Consider the following time series data. Week 1 2 3 4 5 6 Value 19 14...
Consider the following time series data. Week 1 2 3 4 5 6 Value 19 14 17 12 17 14 Develop a three-week moving average for this time series. Compute MSE and a forecast for week 7. Round your answers to two decimal places. Week Time Series Value Forecast 1 19 2 14 3 17 4 12 5 17 6 14 MSE: The forecast for week 7: Use = 0.2 to compute the exponential smoothing values for the time series....
Please help Consider the following time series data. Week 1 N 3 4 5 6 Value...
 Please help
Consider the following time series data. Week 1 N 3 4 5 6 Value 19 11 13 10 14 12 (a) Construct a time series plot. 20 18 20 18 14 12 10 Week 3 4 Week D 20 18+ 16 Time Series Value Time Series Value 5 Week 0 Wook What type of pattem exists in the data? The data appear to follow a cyclical pattern. The data appear to follow a trend pattem. The data appear...
Please help
Consider the following time series data. Week 1 N 3 4 5 6 Value 19 11 13 10 14 12 (a) Construct a time series plot. 20 18 20 18 14 12 10 Week 3 4 Week D 20 18+ 16 Time Series Value Time Series Value 5 Week 0 Wook What type of pattem exists in the data? The data appear to follow a cyclical pattern. The data appear to follow a trend pattem. The data appear...
Given the following data, use exponential smoothing (α=0.2) to develop a demand forecast. Assume the forecast...
 Given the following data, use exponential smoothing (α=0.2) to develop a demand forecast. Assume the forecast for the initial period is 5. Period Demand 4 5 7 913 8 The exponential smoothing forecast is (round your responses to two decimal places): Period 3 刄 7 Forecast 5.00
Two experienced managers at Wilson Boat Inc. are resisting the introduction of a computerized exponential smoothing...
Two experienced managers at Wilson Boat Inc. are resisting the introduction of a computerized exponential smoothing system, claiming that their judgmental forecasts are much better than any computer could do. Their past record of predictions is as follows: Week Actual Demand Manager's Forecast 1 3,800 4,400 2 4,100 4,800 3 4,300 3,700 4 3,100 3,800 5 3,900 3,500 6 4,500 3,500 7 5,700 4,900 8 4,000 4,700 9 4,500 3,500 10 4,900 5,400 How would the manager’s forecast compare to...
Consider the following time series data
 Consider the following time series dataa. Which of the following is a correct time series plot for this data?b. Develop the three-week moving average forecasts for this time series. Compute MSE and a forecast for week 7 (to 2 decimals if necessary) c. Use α = .2 to compute the exponential smoothing forecasts for the time series. Compute MSE and a forecast for week 7 ( 2 decimals). d. Compare the three-week moving average approach with the exponential smoothing approach using α-.2,...
Consider the following gasoline sales time series. If needed, round your answers to two-decimal digits. Week...
Consider the following gasoline sales time series. If needed, round your answers to two-decimal digits. Week Sales (1,000s of gallons) 1 17 2 21 3 16 4 24 5 17 6 18 7 22 8 20 9 21 10 19 11 16 12 25 (a) Show the exponential smoothing forecasts using α = 0.1, and α = 0.2. Exponential Smoothing Week α = 0.1 α = 0.2 13 (b) Applying the MSE measure of forecast accuracy, would you prefer a...
 Problem 08-06 Algo (Moving Averages and Exponential
Smoothing)
Consider the following time series data:
Month
1
2
3
4
5
6
7
Value
23
13
21
13
19
21
17
(a) Choose the correct time series plot Month (iv) Month Select your answer What type of pattern exists in the data? Select your answer- (b) Develop a three-month moving average for this time series. Compute MSE and a forecast for month 8. If required, round your answers to two decimal...
Problem 08-06 Algo (Moving Averages and Exponential
Smoothing)
Consider the following time series data:
Month
1
2
3
4
5
6
7
Value
23
13
21
13
19
21
17
(a) Choose the correct time series plot Month (iv) Month Select your answer What type of pattern exists in the data? Select your answer- (b) Develop a three-month moving average for this time series. Compute MSE and a forecast for month 8. If required, round your answers to two decimal...
 Consider the following time series data.
Week
1
2
3
4
5
6
Value
17
13
15
11
15
13
(a)
Choose the correct time series plot.
(i)
(ii)
(iii)
(iv)
- Select your answer -Graph (i)Graph (ii)Graph (iii)Graph
(iv)Item 1
What type of pattern exists in the data?
- Select your answer -Horizontal PatternTrend PatternItem
2
(b)
Develop a three-week moving average for this time series.
Compute MSE and a forecast for week 7.
If required, round your answers...
Consider the following time series data.
Week
1
2
3
4
5
6
Value
17
13
15
11
15
13
(a)
Choose the correct time series plot.
(i)
(ii)
(iii)
(iv)
- Select your answer -Graph (i)Graph (ii)Graph (iii)Graph
(iv)Item 1
What type of pattern exists in the data?
- Select your answer -Horizontal PatternTrend PatternItem
2
(b)
Develop a three-week moving average for this time series.
Compute MSE and a forecast for week 7.
If required, round your answers...
 Consider the following time series data. Week 1 2 3 4 5 6 Value 19 11 16 1017 15 (a) Construct a time series plot. 20 20 20 18 16 14 12 10 c 14 12 12 0 23 4 5 67 0 23 4 5 67 Week Weck Week 20 18 0 1 2345 6 7 Week What type of pattern exists in the data? The data appear to follow a seasonal pattern. The data appear to follow a...
 Please help
Consider the following time series data. Week 1 N 3 4 5 6 Value 19 11 13 10 14 12 (a) Construct a time series plot. 20 18 20 18 14 12 10 Week 3 4 Week D 20 18+ 16 Time Series Value Time Series Value 5 Week 0 Wook What type of pattem exists in the data? The data appear to follow a cyclical pattern. The data appear to follow a trend pattem. The data appear...
Please help
Consider the following time series data. Week 1 N 3 4 5 6 Value 19 11 13 10 14 12 (a) Construct a time series plot. 20 18 20 18 14 12 10 Week 3 4 Week D 20 18+ 16 Time Series Value Time Series Value 5 Week 0 Wook What type of pattem exists in the data? The data appear to follow a cyclical pattern. The data appear to follow a trend pattem. The data appear...
 Given the following data, use exponential smoothing (α=0.2) to develop a demand forecast. Assume the forecast for the initial period is 5. Period Demand 4 5 7 913 8 The exponential smoothing forecast is (round your responses to two decimal places): Period 3 刄 7 Forecast 5.00
 Consider the following time series dataa. Which of the following is a correct time series plot for this data?b. Develop the three-week moving average forecasts for this time series. Compute MSE and a forecast for week 7 (to 2 decimals if necessary) c. Use α = .2 to compute the exponential smoothing forecasts for the time series. Compute MSE and a forecast for week 7 ( 2 decimals). d. Compare the three-week moving average approach with the exponential smoothing approach using α-.2,...
Most questions answered within 3 hours.
-
. A marketing researcher conducted a survey of 25 shoppers
randomly selected at the local mall...
asked 13 minutes ago -
Create an comprehensive response to the
following:
Antimicrobial agents work on a multitude of microbes (bacteria,...
asked 15 minutes ago -
6.13 LAB: Step counter. Section 6.3.
A pedometer treats walking 2,000 steps as walking 1 mile....
asked 10 minutes ago -
(14.2) A block of mass m = 10 kg riding on a frictionless
horizontal plane is...
asked 13 minutes ago -
Use any search engine to search for articles about Starbucks
partnership with Tata Companies in India...
asked 12 minutes ago -
Let’s say that for some reason Bank Excess Reserves suddenly
increase sharply. What effect would this...
asked 21 minutes ago -
Given:
Curent Assets: $600,000
Total Assets: $2,600,000
Current Liabilities: $500,000
Total Liabilities: $1,700,000
What is the...
asked 26 minutes ago -
1. What is a “Bankster”? What is insider trading? Why is it
illegal?
2. What is...
asked 24 minutes ago -
A transverse wave on a cord is given by
D(x,t)=0.18sin(2.7x−61.0t), where Dand x are in m...
asked 31 minutes ago -
ASSIGNMENT
ANSWER ANY TWO OF THE FOLLOWING IN 2-3 PARAGRAPHS OF EACH
QUESTION.
1: Where is...
asked 29 minutes ago -
Question 1 (5 marks)
Studies have shown that the price elasticity for GP
consultations is -0.2...
asked 31 minutes ago -
The owner of 22 restaurants was asked how he does marketing
research. He answered that he...
asked 35 minutes ago