Consider the following time series data
a. Which of the following is a correct time series plot for this data?
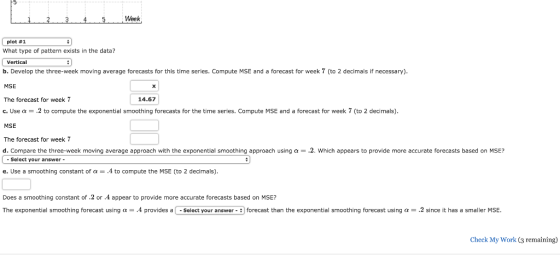
b. Develop the three-week moving average forecasts for this time series. Compute MSE and a forecast for week 7 (to 2 decimals if necessary)
c. Use α = .2 to compute the exponential smoothing forecasts for the time series. Compute MSE and a forecast for week 7 ( 2 decimals).
d. Compare the three-week moving average approach with the exponential smoothing approach using α-.2, which appears to provide more accurate forecasts based on MSE?
e. Use a smoothing constant of α-,4 to compute the MSE (to 2 decimals)
Does a smoothing constant of .2 or .4 appear to provide more accurate forecasts based on MSE?

Homework Answers
Horizontal
b)
| 3 week | ||||
| Time period | Actual Value(A) | Moving avg. Forecast(F) | Forecast error E=|A-F| | Squared Forecast Error |
| 1 | 19 | |||
| 2 | 13 | |||
| 3 | 16 | |||
| 4 | 11 | 16.00 | 5.00 | 25.00 |
| 5 | 18 | 13.33 | 4.67 | 21.78 |
| 6 | 15 | 15.00 | 0.00 | 0.00 |
| Total | 9.67 | 46.78 | ||
| Average | 3.22 | 15.59 | ||
| MAD | MSE |
MSE=15.59
forecast =14.67
c)
| Time period | Actual Value(A) | Forecast(F) | Forecast error E=A-F | Squared Forecast Error |
| 1 | 19 | |||
| 2 | 13 | 19.00 | 6.00 | 36.00 |
| 3 | 16 | 17.80 | 1.80 | 3.24 |
| 4 | 11 | 17.44 | 6.44 | 41.47 |
| 5 | 18 | 16.15 | 1.85 | 3.42 |
| 6 | 15 | 16.52 | 1.52 | 2.32 |
| 17.61 | 86.44 | |||
| Average | 3.52 | 17.29 | ||
| MAD | MSE |
MSE=17.29
forecast =16.22
d)
3 month moving average is better due to smaller MSE
e)
MSE=15.99
provides a better forecast,,,,,,,,,,
Consider the following time series data.
 Please help :) a. Which of the following is a correct time series plot for this data? b. Develop the three-month moving average forecasts for this time series. Compute MSE and a forecast for month 8 (to 2 decimals if necessary). c. Use α-.2 to compute the exponential smoothing forecasts for the time series. Compute MSE and a forecast for month 8 (to 2 decimals). Enter negative values as negative number. d. Compare the three-month moving average approach with the exponential smoothing approach using...
Homework Consider the following time series data. Week Value a. Which of the following is a...
 Homework Consider the following time series data. Week Value a. Which of the following is a correct time series plot for this data? 1 18 2 14 3 17 4 12 5 17 6 15 TimeSeries Value 115 Week TimeSeries Value 3 4 5 Week 2 TimeSeries Value 15 3 4 . 5 Week plot #1 What type of pattern exists in the data? Horizontal a Search this course mework Week plot 01 What type of pattern exists in the...
Consider the following time series data. Week 1 2 3 4 5 6 Value 19 13 16 12 18 14 a. Whic...
Consider the following time series data. Week 1 2 3 4 5 6 Value 19 13 16 12 18 14 a. Which of the following is a correct time series plot for this data? - Select your answer -plot #1plot #2plot #3Item 1 What type of pattern exists in the data? - Select your answer -VerticalHorizontalScatterItem 2 b. Develop the three-week moving average forecasts for this time series. Compute MSE and a forecast for week (to 2 decimals if necessary)....
Omework Consider the following time series data Month 1 2 3 4 5 6 7 Value 21 14 18 13 18 21 14 a....
 omework Consider the following time series data Month 1 2 3 4 5 6 7 Value 21 14 18 13 18 21 14 a. Which of the following is a correct time series plot for this data? や" -Select your answer- What type of pattern exists in the data? -select your answer- b. Develop the three-month moving average forecasts for this time series. Compute MSE and a forecast for month 8 (to 2 decimals if necessary). Enter negative values as...
Consider the following time series data Week 1 2 3 4 5 6 Value 19 14...
 Consider the following time series data Week 1 2 3 4 5 6 Value 19 14 16 12 18 15 a. Which of the following is a correct time series plot for this data? 1 Time eries Value 15 10 Week 2 TimeSeries Value 15 10 5 Week 4 3 TimeSeries Value 15 10 -5 Week 4 5 Select your answer What type of pattern exists in the data? What type of pattern exists in the data? Horizontal b. Develop...
Consider the following time series data. Week 1 2 3 4 5 6 Value 19 11 16 1017 15 (a) Construct a ...
 Consider the following time series data. Week 1 2 3 4 5 6 Value 19 11 16 1017 15 (a) Construct a time series plot. 20 20 20 18 16 14 12 10 c 14 12 12 0 23 4 5 67 0 23 4 5 67 Week Weck Week 20 18 0 1 2345 6 7 Week What type of pattern exists in the data? The data appear to follow a seasonal pattern. The data appear to follow a...
Please help Consider the following time series data. Week 1 N 3 4 5 6 Value...
 Please help
Consider the following time series data. Week 1 N 3 4 5 6 Value 19 11 13 10 14 12 (a) Construct a time series plot. 20 18 20 18 14 12 10 Week 3 4 Week D 20 18+ 16 Time Series Value Time Series Value 5 Week 0 Wook What type of pattem exists in the data? The data appear to follow a cyclical pattern. The data appear to follow a trend pattem. The data appear...
Please help
Consider the following time series data. Week 1 N 3 4 5 6 Value 19 11 13 10 14 12 (a) Construct a time series plot. 20 18 20 18 14 12 10 Week 3 4 Week D 20 18+ 16 Time Series Value Time Series Value 5 Week 0 Wook What type of pattem exists in the data? The data appear to follow a cyclical pattern. The data appear to follow a trend pattem. The data appear...
Consider the following time series data. Week 1 2 3 4 5 6 Value 17 13...
 Consider the following time series data.
Week
1
2
3
4
5
6
Value
17
13
15
11
15
13
(a)
Choose the correct time series plot.
(i)
(ii)
(iii)
(iv)
- Select your answer -Graph (i)Graph (ii)Graph (iii)Graph
(iv)Item 1
What type of pattern exists in the data?
- Select your answer -Horizontal PatternTrend PatternItem
2
(b)
Develop a three-week moving average for this time series.
Compute MSE and a forecast for week 7.
If required, round your answers...
Consider the following time series data.
Week
1
2
3
4
5
6
Value
17
13
15
11
15
13
(a)
Choose the correct time series plot.
(i)
(ii)
(iii)
(iv)
- Select your answer -Graph (i)Graph (ii)Graph (iii)Graph
(iv)Item 1
What type of pattern exists in the data?
- Select your answer -Horizontal PatternTrend PatternItem
2
(b)
Develop a three-week moving average for this time series.
Compute MSE and a forecast for week 7.
If required, round your answers...
Consider the following time series data. Week 1 2 3 4 5 6 Value 19 14...
Consider the following time series data. Week 1 2 3 4 5 6 Value 19 14 17 12 17 14 Develop a three-week moving average for this time series. Compute MSE and a forecast for week 7. Round your answers to two decimal places. Week Time Series Value Forecast 1 19 2 14 3 17 4 12 5 17 6 14 MSE: The forecast for week 7: Use = 0.2 to compute the exponential smoothing values for the time series....
 Please help :) a. Which of the following is a correct time series plot for this data? b. Develop the three-month moving average forecasts for this time series. Compute MSE and a forecast for month 8 (to 2 decimals if necessary). c. Use α-.2 to compute the exponential smoothing forecasts for the time series. Compute MSE and a forecast for month 8 (to 2 decimals). Enter negative values as negative number. d. Compare the three-month moving average approach with the exponential smoothing approach using...
 Homework Consider the following time series data. Week Value a. Which of the following is a correct time series plot for this data? 1 18 2 14 3 17 4 12 5 17 6 15 TimeSeries Value 115 Week TimeSeries Value 3 4 5 Week 2 TimeSeries Value 15 3 4 . 5 Week plot #1 What type of pattern exists in the data? Horizontal a Search this course mework Week plot 01 What type of pattern exists in the...
 omework Consider the following time series data Month 1 2 3 4 5 6 7 Value 21 14 18 13 18 21 14 a. Which of the following is a correct time series plot for this data? や" -Select your answer- What type of pattern exists in the data? -select your answer- b. Develop the three-month moving average forecasts for this time series. Compute MSE and a forecast for month 8 (to 2 decimals if necessary). Enter negative values as...
 Consider the following time series data Week 1 2 3 4 5 6 Value 19 14 16 12 18 15 a. Which of the following is a correct time series plot for this data? 1 Time eries Value 15 10 Week 2 TimeSeries Value 15 10 5 Week 4 3 TimeSeries Value 15 10 -5 Week 4 5 Select your answer What type of pattern exists in the data? What type of pattern exists in the data? Horizontal b. Develop...
 Consider the following time series data. Week 1 2 3 4 5 6 Value 19 11 16 1017 15 (a) Construct a time series plot. 20 20 20 18 16 14 12 10 c 14 12 12 0 23 4 5 67 0 23 4 5 67 Week Weck Week 20 18 0 1 2345 6 7 Week What type of pattern exists in the data? The data appear to follow a seasonal pattern. The data appear to follow a...
 Please help
Consider the following time series data. Week 1 N 3 4 5 6 Value 19 11 13 10 14 12 (a) Construct a time series plot. 20 18 20 18 14 12 10 Week 3 4 Week D 20 18+ 16 Time Series Value Time Series Value 5 Week 0 Wook What type of pattem exists in the data? The data appear to follow a cyclical pattern. The data appear to follow a trend pattem. The data appear...
Please help
Consider the following time series data. Week 1 N 3 4 5 6 Value 19 11 13 10 14 12 (a) Construct a time series plot. 20 18 20 18 14 12 10 Week 3 4 Week D 20 18+ 16 Time Series Value Time Series Value 5 Week 0 Wook What type of pattem exists in the data? The data appear to follow a cyclical pattern. The data appear to follow a trend pattem. The data appear...
 Consider the following time series data.
Week
1
2
3
4
5
6
Value
17
13
15
11
15
13
(a)
Choose the correct time series plot.
(i)
(ii)
(iii)
(iv)
- Select your answer -Graph (i)Graph (ii)Graph (iii)Graph
(iv)Item 1
What type of pattern exists in the data?
- Select your answer -Horizontal PatternTrend PatternItem
2
(b)
Develop a three-week moving average for this time series.
Compute MSE and a forecast for week 7.
If required, round your answers...
Consider the following time series data.
Week
1
2
3
4
5
6
Value
17
13
15
11
15
13
(a)
Choose the correct time series plot.
(i)
(ii)
(iii)
(iv)
- Select your answer -Graph (i)Graph (ii)Graph (iii)Graph
(iv)Item 1
What type of pattern exists in the data?
- Select your answer -Horizontal PatternTrend PatternItem
2
(b)
Develop a three-week moving average for this time series.
Compute MSE and a forecast for week 7.
If required, round your answers...
Most questions answered within 3 hours.
-
You and your friends are playing in the swimming pool with a
40-cm-diameter beach ball. How...
asked 1 minute from now -
Patterson Development sometimes sells property on an installment
basis. In those cases, Patterson reports income in...
asked 10 minutes ago -
please help with these two example, i want to double check my
work. thanks
1.
sum:=0...
asked 7 minutes ago -
in the formation of 1.0 mole of the following crystalline solids
from the gaseous ions most...
asked 13 minutes ago -
Please answer Letter G only.
Price
Quantity
TR
MR
MC
TC
Profit
$15,000
0
0
----...
asked 14 minutes ago -
You are required to develop and submit a 12-month integrated
marketing communications plan for the KFC...
asked 16 minutes ago -
Let v=(1,-4,12) and w=(3,5,-1) be vectors.
What is 2v-3w?
asked 32 minutes ago -
What is the [A2-] (in mol L-1) of a solution containing 1.355
mol L-1 of a...
asked 27 minutes ago -
Suppose an equilibrium mixture consists of 0.46 atm
N2O4 and 2.0 atm NO2, and the
volume...
asked 24 minutes ago -
9. Answer the following questions related to the size of a
program and memory space.
A)...
asked 29 minutes ago -
What organ is the site of gas exchange in amphibians? select
all that apply
spleen
lungs...
asked 30 minutes ago -
Function 4: my-map
In CLISP define your own function that duplicates the
functionality of mapcar from...
asked 58 minutes ago