2.1. Obtain process response curve in time domain for a step input of a magnitude of...
- 2.1. Obtain process response curve in time domain for a step input of a magnitude of 0.5. (6)
- 2.2. Plot the response curves in a single figure. (use EXCEL, submit the EXCEL file too) (20)
- 2.3. Explain how the values of the transfer function zeros affect the shape of the response curves? (4)
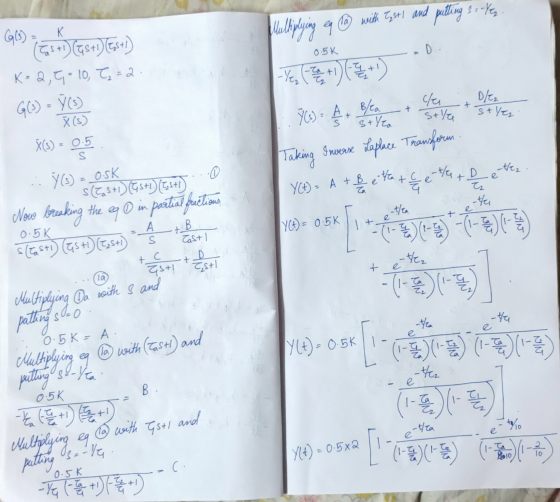
A process has a transfer function with the following equation ?(?)=?(???+1)(?1?+1)(?2?+1) with =2, ?1=10,?2=2. If ?? has the following case values
Case i: ??=20
Case ii: ??=4
Case iii: ??=1
Case iv:??=−2
For each case (i-iv)
[30
Homework Answers

Plotting the response in Excel
DEclaring the function in Ms-Excel


The plot is given as

There is no Zeroes here but with the introduction of zeroes
1) Adding left hand plane(-ve) zero would increase stability and increase overshoot of the response
2)Adding right hand plane(+ve) zero to the transfer function would slow down the response
Case 4 here is unstable
Add Answer to:
2.1. Obtain process response curve in time domain for a step
input of a magnitude of...
Question 2: Poles and zeros, and how they affect the transient response modes This question tests...
 Question 2: Poles and zeros, and how they affect the transient response modes This question tests your understanding of the effects of nearby poles and ze- ros to the response mode of a specified pole (or conjugate pair). You should also understand what a pole-zero-gain plot is and how it is specified by, and specifies a transfer function A unit impulse function is applied to the system described by the transfer function G(8) = K (8+) (s + 1)(8 +2)...
Problem 6 Model Parameters from the Transient Response The step input r(t) = Rous(t) (R(8) =...
 Problem 6 Model Parameters from the Transient Response The step input r(t) = Rous(t) (R(8) = Ro/s) is applied to a system whose block diagram model is given below in Figure 8.24. The corresponding step response measurement is shown in Figure 8.25. In the sten response measurement, note that peak time is to = - ( 1.96) and the peak value is ctp) = 2.2. The open-loop transfer function G(s) is of the form $(8 + a) where a and...
Question 1-4 is about the following mechanical system: Data: ki-20 [N/m] b-2 [Ns/m] k2# 10 [N/m] m2 At) mi Question 1 X...
 Question 1-4 is about the following mechanical system: Data: ki-20 [N/m] b-2 [Ns/m] k2# 10 [N/m] m2 At) mi Question 1 X1(s) Develop the symbolic transfer function G1(s)2 F(s) 1.1 Determine the differential equation, that this transfer function describe 1.2 Question 2 Sketch the step response for G1(s), using Matlab and explain the process 2.1 Sketch the pole /zero diagram for the transfer function G1(s) and reflect on the relation between the step response and the pole /zero diagram 2.2...
(a) A system has the impulse response, h[n], and is excited with the input signal, xIn], as shown below. Using either a mathematical or a graphical convolution technique, determine the outp...
 (a) A system has the impulse response, h[n], and is excited with the input signal, xIn], as shown below. Using either a mathematical or a graphical convolution technique, determine the output of the system, y[n] (that is, evaluate y[n] h[nl'xIn], where" denotes convolution). 17 marks xIn INPUT FIR filter 0.5 0.25 OUTPUT 0 1 345 6 7 .. 0.5 0123 4567 (b) An IIR filter is shown below: ylnl One sample delay (z) 0.4 i) Derive the difference equation describing...
- Frequency Response (Amplitude Response only). Hz). with frequency, 22. for a discrete time system shown...
 - Frequency Response (Amplitude Response only). Hz). with frequency, 22. for a discrete time system shown below. *(-1) - x[-2] - ... -0 and yf-1) - Y[-2] ... - x[r] - int) Find “Math Model" for the system. nt) Find "Transfer Function" for the system. Draw the pole-zero plot for the system (use unit circle on Re-Im axis) Sketch the amplitude response of the system → indicate values at important points (92 = 0, 1/4, 21/4, 37/4, T) include detailed...
a) The transfer function of an ideal low-pass filter is and its impulse response is where...
 a) The transfer function of an ideal low-pass filter is and its impulse response is where oc is the cut-off frequency i) Is hLP[n] a finite impulse response (FIR) filter or an infinite impulse response filter (IIR)? Explain your answer ii Is hLP[n] a causal or a non-causal filter? Explain your answer iii) If ae-0. IT, plot the magnitude responses for the following impulse responses b) i) Let the five impulse response samples of a causal FIR filter be given...
As a process engineer with the Complex Pole Corporation, you are assigned a unit with an exothermic chemical reacto...
 As a process engineer with the Complex Pole Corporation, you are assigned a unit with an exothermic chemical reactor, In order to learn more about the dynamics of the process, you decide to make a step change in the input variable, the coolant temperature, from 10 °C to 15 C. Assume that the reactor was operating initially at steady state. You obtain the following plot (FIGURE Q2) for the output variable, which is the reactor temperature. 290 285 280 275...
-157-63 a li 1.17 +구-1-245 e + 0.071, e (e) Plot the voltage response v(t) in the time domain ...
 this is the v(t)
-157-63 a li 1.17 +구-1-245 e + 0.071, e (e) Plot the voltage response v(t) in the time domain using MATLAB. Plot v(c) over the specified time interval using a blue solid line of width lines of width 2. The minimum font size is 16. i. i. Plot the capacitor's voltage rating threshold as horizontal black dashed i. Label both axes with the appropriate physical quantity as well as units. iv. The minimum font size for...
this is the v(t)
-157-63 a li 1.17 +구-1-245 e + 0.071, e (e) Plot the voltage response v(t) in the time domain using MATLAB. Plot v(c) over the specified time interval using a blue solid line of width lines of width 2. The minimum font size is 16. i. i. Plot the capacitor's voltage rating threshold as horizontal black dashed i. Label both axes with the appropriate physical quantity as well as units. iv. The minimum font size for...
Design a controller for the transfer function)5)(1(1)(++=sssGto obtain (i) zero steady-stateerror due to step, (ii) a...
Design a controller for the transfer function)5)(1(1)(++=sssGto obtain (i) zero steady-stateerror due to step, (ii) a settling time of less than 2 s, and (iii) an undamped natural frequency of 5 rad/s. Obtain the response due to a unit step and find the percentage overshoot, the time to the first peak and steady-state error percent due to a ramp input
Question 2 2.1 Consider a stirred tank heater which is characterised by the following equation: z4 pCpE The tank ha...
 Question 2 2.1 Consider a stirred tank heater which is characterised by the following equation: z4 pCpE The tank has a constant liquid volume V, 50 litres and a constant volumetric flow rate of F 10 litres/minute. For liquid water, the other parameters are pCp 1 kcal/ litre.°C. Determine the process gain and time constant of the system. 2.1.1 2.1.2 Write down the transfer function of the process. (9) 2.1.3 Determine the time-domain output of this process to a step...
 Question 2: Poles and zeros, and how they affect the transient response modes This question tests your understanding of the effects of nearby poles and ze- ros to the response mode of a specified pole (or conjugate pair). You should also understand what a pole-zero-gain plot is and how it is specified by, and specifies a transfer function A unit impulse function is applied to the system described by the transfer function G(8) = K (8+) (s + 1)(8 +2)...
 Problem 6 Model Parameters from the Transient Response The step input r(t) = Rous(t) (R(8) = Ro/s) is applied to a system whose block diagram model is given below in Figure 8.24. The corresponding step response measurement is shown in Figure 8.25. In the sten response measurement, note that peak time is to = - ( 1.96) and the peak value is ctp) = 2.2. The open-loop transfer function G(s) is of the form $(8 + a) where a and...
 Question 1-4 is about the following mechanical system: Data: ki-20 [N/m] b-2 [Ns/m] k2# 10 [N/m] m2 At) mi Question 1 X1(s) Develop the symbolic transfer function G1(s)2 F(s) 1.1 Determine the differential equation, that this transfer function describe 1.2 Question 2 Sketch the step response for G1(s), using Matlab and explain the process 2.1 Sketch the pole /zero diagram for the transfer function G1(s) and reflect on the relation between the step response and the pole /zero diagram 2.2...
 (a) A system has the impulse response, h[n], and is excited with the input signal, xIn], as shown below. Using either a mathematical or a graphical convolution technique, determine the output of the system, y[n] (that is, evaluate y[n] h[nl'xIn], where" denotes convolution). 17 marks xIn INPUT FIR filter 0.5 0.25 OUTPUT 0 1 345 6 7 .. 0.5 0123 4567 (b) An IIR filter is shown below: ylnl One sample delay (z) 0.4 i) Derive the difference equation describing...
 - Frequency Response (Amplitude Response only). Hz). with frequency, 22. for a discrete time system shown below. *(-1) - x[-2] - ... -0 and yf-1) - Y[-2] ... - x[r] - int) Find “Math Model" for the system. nt) Find "Transfer Function" for the system. Draw the pole-zero plot for the system (use unit circle on Re-Im axis) Sketch the amplitude response of the system → indicate values at important points (92 = 0, 1/4, 21/4, 37/4, T) include detailed...
 a) The transfer function of an ideal low-pass filter is and its impulse response is where oc is the cut-off frequency i) Is hLP[n] a finite impulse response (FIR) filter or an infinite impulse response filter (IIR)? Explain your answer ii Is hLP[n] a causal or a non-causal filter? Explain your answer iii) If ae-0. IT, plot the magnitude responses for the following impulse responses b) i) Let the five impulse response samples of a causal FIR filter be given...
 As a process engineer with the Complex Pole Corporation, you are assigned a unit with an exothermic chemical reactor, In order to learn more about the dynamics of the process, you decide to make a step change in the input variable, the coolant temperature, from 10 °C to 15 C. Assume that the reactor was operating initially at steady state. You obtain the following plot (FIGURE Q2) for the output variable, which is the reactor temperature. 290 285 280 275...
 this is the v(t)
-157-63 a li 1.17 +구-1-245 e + 0.071, e (e) Plot the voltage response v(t) in the time domain using MATLAB. Plot v(c) over the specified time interval using a blue solid line of width lines of width 2. The minimum font size is 16. i. i. Plot the capacitor's voltage rating threshold as horizontal black dashed i. Label both axes with the appropriate physical quantity as well as units. iv. The minimum font size for...
this is the v(t)
-157-63 a li 1.17 +구-1-245 e + 0.071, e (e) Plot the voltage response v(t) in the time domain using MATLAB. Plot v(c) over the specified time interval using a blue solid line of width lines of width 2. The minimum font size is 16. i. i. Plot the capacitor's voltage rating threshold as horizontal black dashed i. Label both axes with the appropriate physical quantity as well as units. iv. The minimum font size for...
 Question 2 2.1 Consider a stirred tank heater which is characterised by the following equation: z4 pCpE The tank has a constant liquid volume V, 50 litres and a constant volumetric flow rate of F 10 litres/minute. For liquid water, the other parameters are pCp 1 kcal/ litre.°C. Determine the process gain and time constant of the system. 2.1.1 2.1.2 Write down the transfer function of the process. (9) 2.1.3 Determine the time-domain output of this process to a step...
Most questions answered within 3 hours.
-
Cardiolipin is not found in which of the following?
a) kidney proximal tubule
b) cardiac muscle...
asked 28 minutes ago -
A business employs three individuals, whose taxable earnings to
date (prior to the current pay period)...
asked 8 minutes ago -
Ice of mass 52.0 g at -10.9° C is added to 220 g of water at...
asked 28 minutes ago -
A 2.8 kg block of wood sits on a table. A 3.0 g bullet, fired
horizontally...
asked 23 minutes ago -
This question is about specialization and trade.
A.) Suppose a worker in the U.S. can produce...
asked 15 minutes ago -
ETHICAL DILEMMA: Producing toys-child's play? You are the
product manager of a confectionery company that includes...
asked 22 minutes ago -
AI, Robotics, Machine Learning, etc.
1. How do we distinguish between robotics and machine
learning?
2....
asked 27 minutes ago -
implement a binary search function in 3 programming
languages. In each program (identical, except for the...
asked 30 minutes ago -
Which storage technology has two parities for each data
block?
A) RAID0
B) RAID1
C) RAID5...
asked 29 minutes ago -
bleach is 6.00% NaClO by weight and the density is
1.07g/ml. How many grams of NaClO...
asked 43 minutes ago -
Given what you know about juvenile delinquency, if government
officials asked for your guidance on how...
asked 44 minutes ago -
Citation Builders, Inc., builds office buildings and
single-family homes. The office buildings are constructed under
contract...
asked 59 minutes ago