

Homework Answers
Question (a)
From the diagram, we can write
![Y[n] = x[n] + 5yın – 1] - *y[n – 2]](http://img.homeworklib.com/questions/f4cf71a0-8141-11ec-a9bd-65cd5b635903.png?x-oss-process=image/resize,w_560)
So the difference equation relating the input and the output is
![Y[n] = x[n] + 5yın – 1] - *y[n – 2]](http://img.homeworklib.com/questions/f5288690-8141-11ec-9cf1-7f95d52c86fa.png?x-oss-process=image/resize,w_560)
Taking Z transform on both sides, we get

We have used the shifting property of Z transform here, which states that
If
![(2)X = {[u]x}](http://img.homeworklib.com/questions/f5e09c00-8141-11ec-a860-abb5219db494.png?x-oss-process=image/resize,w_560)
Then
![(2)x - 2 = {[êu – 4]}z](http://img.homeworklib.com/questions/f6329800-8141-11ec-9ef9-771d0b8ed049.png?x-oss-process=image/resize,w_560)


So, the transfer function of the system is


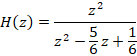

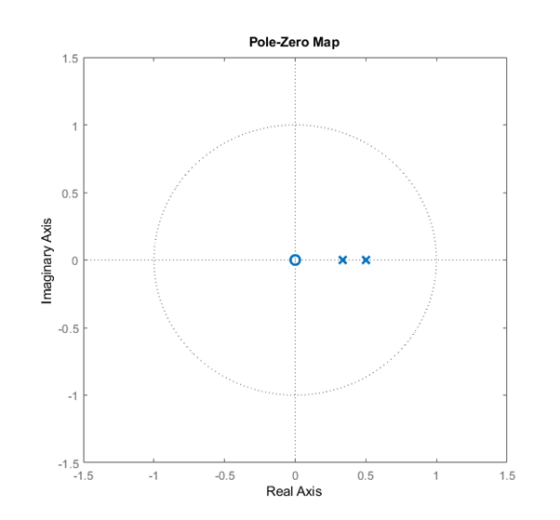
Poles are at


Zeros are at

So the pole zero plot is
Question (b)
We have derived the transfer function of the filter in part (a) which is
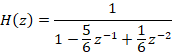
To obtain the frequency response,
substitute
We get


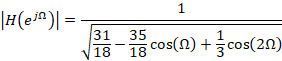
Amplitude Response will be


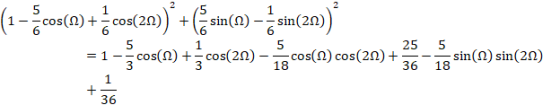
![(1-cos(m) +.cos(20) + (6 sin(n) sin(20) =1+3+ $cos(n) +şcos(21) (cos(2) cos(29) + sin(12) sin(20)]](http://img.homeworklib.com/questions/ff20ac70-8141-11ec-a6b0-b9fe7a99a851.png?x-oss-process=image/resize,w_560)
![(1 - cos(n) +.cos(20) + (7 sin(n) -+ sin(2n))* - cos(n) +şcos(21) (cos(1) (1 – 2 sinº(2)) + sin(12) 2 sin(1) cos(12)]](http://img.homeworklib.com/questions/ff7a1770-8141-11ec-867c-ada01a42cadb.png?x-oss-process=image/resize,w_560)
![(1- cos(n) + cos2n)* + (sin(n) - h.sin(20) - 1 * cos(n) +.cos(21) (cos(1) – 2. sin’() cos(1) + 2 sin? (2) cos(2)]](http://img.homeworklib.com/questions/ffd15cd0-8141-11ec-917c-bd20efb4e03a.png?x-oss-process=image/resize,w_560)
![(1- cos(n)+(cos(2n)* + (* sin(m) –sin(2n)) = cos(n) +şcos(21) - [cos()]](http://img.homeworklib.com/questions/0023af20-8142-11ec-bd34-9b1f13b71f0a.png?x-oss-process=image/resize,w_560)


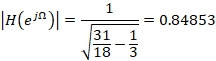
At 
![\H(e))] = 7 21 hs cos(0) +şcos(0)](http://img.homeworklib.com/questions/01ec76b0-8142-11ec-8a79-bb75a7992452.png?x-oss-process=image/resize,w_560)

At 


At 


At 


At 


Using these values we can plot the amplitude response as follows

Question (b)


So

The frequency corresponding to
 rad/sample

The frequency corresponding to
 rad/sample

The frequency corresponding to
 rad/sample

The frequency corresponding to
 rad/sample

The frequency corresponding to
 rad/sample

So the plot will be

Question (d)
From the amplitude response, we can say that the given system is a low pass filter. This is because as frequency increases, the gain decreases.
The cut off frequency corresponds to
the frequency when the gain is  times the
maximum gain. Here the maximum gain is 3 at 0 rad/sample.
times the
maximum gain. Here the maximum gain is 3 at 0 rad/sample.
So the gain at cut off frequency will be

So

Squaring


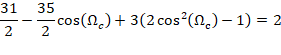


Solving

First value cant be correct as cosine of a number can never be greater than 1
So the correct one is

So

So the cut off frequency in Hz will be

Add Answer to:
- Frequency Response (Amplitude Response only). Hz). with frequency, 22. for a discrete time system shown...
A discrete-time LTI system with a cumpling frequency of 8kHz is shown in Figure 4.1. The...
 A discrete-time LTI system with a cumpling frequency of 8kHz is shown in Figure 4.1. The rectangular boxes with the label z provide one sample period delay to their input signals. The circular components are adders or subtractors. The triangular components provide linear gain factors of or by, where i is 0, 1 or 2 a) Derive the system transfer function H(z). b) Find the difference equation relating the output y[n) and input x[n). c) Given that the gain values...
Bonus Question) A discrete-time LTI system with a sampling frequency of Ukm2 is shown in the...
 Bonus Question) A discrete-time LTI system with a sampling frequency of Ukm2 is shown in the following Figure. The rectangular boxes with the label z provide one sample period delay to their input signals. The circular components are adders or subtractors. The triangular components provide linear vain factors of ar or bi where i is 0,1 or 2. i) Derive the system transfer function H(2). ü) Find the difference equation relating the output y[n] and input x[n]. iii) Given that...
For a causal LTI discrete-time system described by the difference equation:
For a causal LTI discrete-time system described by the difference equation: y[n] + y[n – 1] = x[n] a) Find the transfer function H(z).b) Find poles and zeros and then mark them on the z-plane (pole-zero plot). Is this system BIBO? c) Find its impulse response h[n]. d) Draw the z-domain block diagram (using the unit delay block z-1) of the discrete-time system. e) Find the output y[n] for input x[n] = 10 u[n] if all initial conditions are 0.
A causal discrete-time LTI system is described by the equation
A causal discrete-time LTI system is described by the equationwhere z is the input signal, and y the output signal y(n) = 1/3x(n) + 1/3x(n -1) + 1/3x(n - 2) (a) Sketch the impulse response of the system. (b) What is the dc gain of the system? (Find Hf(0).) (c) Sketch the output of the system when the input x(n) is the constant unity signal, x(n) = 1. (d) Sketch the output of the system when the input x(n) is the unit step signal, x(n)...
The frequency response Hf(w) of a discrete-time LTI system is as shown.
 The frequency response Hf(w) of a discrete-time LTI system is as shown. Hf(w) is real-valued so the phase is 0. Find the output y(n) when the input x(n) is x(n) = 1+cos(0.3πn). Put y(n) in simplest real form (your answer should not contain j)
1. A discrete-time system has seven poles at z 0 and seven zeros at Find the...
 1. A discrete-time system has seven poles at z 0 and seven zeros at Find the transfer function H(z) and find the constant term bo such that the gain of the filter at zero angle (8-0) is 1, that is, a. Note that H (θ)-H(z)IFeje and H(θ)18-0-1 is equivalent to H(z)IF1-1 b. Plot the pole-zero diagram. c. Plot the magnitude response |H(6) d. Plot the phase response H(6) e. Find yin) as a function of x(n), x(n-1), x(n-2), x(n-3),x(n-4), x(n-5),x(n-6),x(n-7)
1. Pole-zero placement. We wish to design a stable and causal second-order discrete-time (DT) fil...
 1. Pole-zero placement. We wish to design a stable and causal second-order discrete-time (DT) filter (i.e., having two poles and two zeros, including those at 0 and oo) using pole-zero placement. (a) [5 pts] Where might you place the poles and zeros to achieve the following magnitude frequency response? Sketch the pole-zero plot in the complex z-plane. -Π -Tt/2 0 (b) [3 pts] Give an expression for the transfer function H(z). Justify your answer. (c) [2 pts] Write an expression...
Question 5 (a) The impulse response of a discrete-time filter is given as, hin) 0.56n-1] +n-2)0.5...
 Question 5 (a) The impulse response of a discrete-time filter is given as, hin) 0.56n-1] +n-2)0.56 n -3]. i. Derive the filter's frequency response; 11. Roughly sketch the filter's magnitude response for 0 ii. Is it a low-pass or high-pass filter? Ω 2m; (b) A continuous-time signal se(t) is converted into a discrete-time signal as shown below. s(t) is a unit impulse train. s(t) x,) Conversion into x(1) __→ⓧ一ㄅㄧ-discrete-time sequence ー→ xu [n] The frequency spectrum of ap (t) is...
Problem #1. Topics: Z Transform Find the Z transform of: x[n]=-(0.9 )n-2u-n+5] X(Z) Problem #2. T...
 Problem #1. Topics: Z Transform Find the Z transform of: x[n]=-(0.9 )n-2u-n+5] X(Z) Problem #2. Topics: Filter Design, Effective Time Constant Design a causal 2nd order, normalized, stable Peak Filter centered at fo 1000Hz. Use only two conjugate poles and two zeros at the origin. The system is to be sampled at Fs- 8000Hz. The duration of the transient should be as close as possible to teft 7.5 ms. The transient is assumed to end when the largest pole elevated...
5 11 Question 3 2 pts Consider a discrete-time linear system with frequency response H(12) =...
 5 11 Question 3 2 pts Consider a discrete-time linear system with frequency response H(12) = en The input to the system is the signal (0.2+ef) x[k] = 2 cos(1.2k).The output of the system is the signal y[k]. y[k]is a cosine with amplitude approximately equal to: 4.566 0.578 0.919 1.837
 A discrete-time LTI system with a cumpling frequency of 8kHz is shown in Figure 4.1. The rectangular boxes with the label z provide one sample period delay to their input signals. The circular components are adders or subtractors. The triangular components provide linear gain factors of or by, where i is 0, 1 or 2 a) Derive the system transfer function H(z). b) Find the difference equation relating the output y[n) and input x[n). c) Given that the gain values...
 Bonus Question) A discrete-time LTI system with a sampling frequency of Ukm2 is shown in the following Figure. The rectangular boxes with the label z provide one sample period delay to their input signals. The circular components are adders or subtractors. The triangular components provide linear vain factors of ar or bi where i is 0,1 or 2. i) Derive the system transfer function H(2). ü) Find the difference equation relating the output y[n] and input x[n]. iii) Given that...
 1. A discrete-time system has seven poles at z 0 and seven zeros at Find the transfer function H(z) and find the constant term bo such that the gain of the filter at zero angle (8-0) is 1, that is, a. Note that H (θ)-H(z)IFeje and H(θ)18-0-1 is equivalent to H(z)IF1-1 b. Plot the pole-zero diagram. c. Plot the magnitude response |H(6) d. Plot the phase response H(6) e. Find yin) as a function of x(n), x(n-1), x(n-2), x(n-3),x(n-4), x(n-5),x(n-6),x(n-7)
 1. Pole-zero placement. We wish to design a stable and causal second-order discrete-time (DT) filter (i.e., having two poles and two zeros, including those at 0 and oo) using pole-zero placement. (a) [5 pts] Where might you place the poles and zeros to achieve the following magnitude frequency response? Sketch the pole-zero plot in the complex z-plane. -Π -Tt/2 0 (b) [3 pts] Give an expression for the transfer function H(z). Justify your answer. (c) [2 pts] Write an expression...
 Question 5 (a) The impulse response of a discrete-time filter is given as, hin) 0.56n-1] +n-2)0.56 n -3]. i. Derive the filter's frequency response; 11. Roughly sketch the filter's magnitude response for 0 ii. Is it a low-pass or high-pass filter? Ω 2m; (b) A continuous-time signal se(t) is converted into a discrete-time signal as shown below. s(t) is a unit impulse train. s(t) x,) Conversion into x(1) __→ⓧ一ㄅㄧ-discrete-time sequence ー→ xu [n] The frequency spectrum of ap (t) is...
 Problem #1. Topics: Z Transform Find the Z transform of: x[n]=-(0.9 )n-2u-n+5] X(Z) Problem #2. Topics: Filter Design, Effective Time Constant Design a causal 2nd order, normalized, stable Peak Filter centered at fo 1000Hz. Use only two conjugate poles and two zeros at the origin. The system is to be sampled at Fs- 8000Hz. The duration of the transient should be as close as possible to teft 7.5 ms. The transient is assumed to end when the largest pole elevated...
 5 11 Question 3 2 pts Consider a discrete-time linear system with frequency response H(12) = en The input to the system is the signal (0.2+ef) x[k] = 2 cos(1.2k).The output of the system is the signal y[k]. y[k]is a cosine with amplitude approximately equal to: 4.566 0.578 0.919 1.837
Most questions answered within 3 hours.
-
1) Name the three holes located in the greater wing of the
sphenoid bone in order...
asked 1 second from now -
For the following reaction set-up, which type of hydrocarbon
product would form? 1,4-hexadiene + two Cl2...
asked 2 minutes ago -
Consider the following method that is intended to determine if
the double values d1 and d2...
asked 14 minutes ago -
could someone please post clear drawings of the three structures
in the equilibrium mixture of D-glucose...
asked 21 minutes ago -
Using the Properties of Order show that 5n5 +
4n4 + 6n3 + 2n2+ n +...
asked 25 minutes ago -
What is experiential learning and how is it helpful for teaching
leadership, and interpreting group dynamics?...
asked 24 minutes ago -
A security awareness policy defines the responsibilities of
managers and information owners.
True
False
asked 26 minutes ago -
which is the equilibrium expression for the reaction
3A(g)+4B(g)<---> 2C(g)+5D(g)
asked 27 minutes ago -
Create a balanced compensation plan that you feel would
encourage a restaurant manager to be more...
asked 34 minutes ago -
Re: Human Physiology
Comment on the differences between representing V02 max as an
absolute number and...
asked 37 minutes ago -
A firm with a WACC of 10% is considering the following mutually
exclusive projects:
0
1...
asked 41 minutes ago -
. A 100.0 mL sample of 0.18 M HClO4 is titrated with 0.27 M
LiOH. Determine...
asked 1 hour ago