We find a sample of people and we weigh each person. The distribution of their weights...
We find a sample of people and we weigh each person. The distribution of their weights is positively skewed with a mean of 157 and a standard deviation of 47. If this distribution is transformed into z-scores, what will be the resulting shape, mean, and standard deviation of the new distribution?
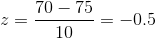
For a population with µ = 75 and σ = 10 find the z-score corresponding to the following raw scores X = 70 X = 77 X = 75
Homework Answers
The distribution of their weights is positively skewed with a mean of 157 and a standard deviation of 47.
If this distribution is transformed into z-score, then shape of the new distribution is bell shape.
Mean = 0
Standard deviation = 1
( By using central limit theorem)
For a population with µ = 75 and σ = 10
We have to find z score.

x = 70
x = 77

x = 75

Add Answer to:
We find a sample of people and we weigh each person. The
distribution of their weights...
Suppose that we will randomly select a sample of 72 measurements from a population having a...
Suppose that we will randomly select a sample of 72 measurements from a population having a mean equal to 18 and a standard deviation equal to 9. (a) Describe the shape of the sampling distribution of the sample mean. Do we need to make any assumptions about the shape of the population? Why or why not? (b) Find the mean and the standard deviation of the sampling distribution of the sample mean. (Round your σx⎯⎯ answer to 1 decimal place.)...
Suppose that we will randomly select a sample of 109 measurements from a population having a...
Suppose that we will randomly select a sample of 109 measurements from a population having a mean equal to 21 and a standard deviation equal to 8. (a) Describe the shape of the sampling distribution of the sample mean . Do we need to make any assumptions about the shape of the population? Why or why not? (b) Find the mean and the standard deviation of the sampling distribution of the sample mean . (Round your σx¯σx¯ answer to 1...
- What proportion of a normal distribution is located between each of the following Z-score boundaries?...
What proportion of a normal distribution is located between each of the following Z-score boundaries? a. z= -0.50 and z= +0.50 b. z=-0.90 and z= +0.90 c. z=-1.50 and z= 1.50 For a normal distribution with a mean of μ = 80 and a standard deviation of σ= 20, find the proportion of the population corresponding to each of the following. a. Scores greater than 85. b. Scores less than 100. c. Scores between 70 and 90. IQ test scores are standardized to produce a normal distribution with...
Normal Distribution Problems
Example 1. Assume that the random variable X follows the Normal distribution with mean 75 and standard deviation 10. Use Python to(a) Compute P(65 < X < 85) and interpret the findings(b) Compute P(55 < X < 95) and interpret the findings(c) Compute P(X > 100) and interpret the findingsExample 2. Assume that the random variable X follows the Normal distribution with mean µ and standard deviation σ. Compute (a) P(µ − σ < X < µ + σ) (b) P(µ −...
QUESTION 1 The normal curve is particularly useful as a model for a. data in which...
QUESTION 1 The normal curve is particularly useful as a model for a. data in which mean and median differ b. many populations of psychological and educational data c. distributions of sample statistics d. both (b) and (c) above QUESTION 2 A distribution has a mean of 60 and a standard deviation of 8. For a score of 72, the equivalent z score a. is +1.5 b. is between 0 and +1.0 c. is + 1.2 d. cannot be determined...
For a normal distribution of raw scores with µ= 75, σ = 8, answer the following. ...
For a normal distribution of raw scores with µ= 75, σ = 8, answer the following. What is the probability of p(71 < X < 83) ? __________ Find the percentile ranking for the raw score X = 65th ______ percentile
Suppose there is a raw. NOT standardized distribution of IQ scores with a mean of μ-116...
 Suppose there is a raw. NOT standardized distribution of IQ scores with a mean of μ-116 and a standard deviation of σ-16. Suppose your raw IQ score in this distribution is X-148. What is your z-score in this distribution? O +2.00 0-1.50 O -2.00 О +1.50
#3 One of the most common ways of measuring intelligence is the IQ test. IQ scores...
#3 One of the most common ways of measuring intelligence is the IQ test. IQ scores in the US population have an average of µ = 100 and a standard deviation of σ = 15. Suppose a researcher wanted to test whether socioeconomic status (SES) has an effect on IQ scores. The researcher takes a random sample of n = 100 people, selected from a list of the 1000 richest people in the United States. a. Based on this information,...
1. The distribution of heights of adult females: We assume that height is normally distributed with...
1. The distribution of heights of adult females: We assume that height is normally distributed with a population mean of 65 inches and a population standard deviation of 4 inches. 2. The distribution of heights of adult males: We assume that height is normally distributed with a population mean of 70 inches and a population standard deviation of 5 inches. a. Above what Z-score value does 2.5% of the normal distribution fall? Using the formula for Z-scores and the Z-score...
2. Assume that weights of newborn children are normally distributed with a mean (µ) of 116...
2. Assume that weights of newborn children are normally distributed with a mean (µ) of 116 ounces and a standard deviation (σ) of 12 ounces. Find the upper and lower limits that separate the top 5% and the bottom 5%. please show how z score and standard deviation is found.
 Suppose there is a raw. NOT standardized distribution of IQ scores with a mean of μ-116 and a standard deviation of σ-16. Suppose your raw IQ score in this distribution is X-148. What is your z-score in this distribution? O +2.00 0-1.50 O -2.00 О +1.50
Most questions answered within 3 hours.
-
A single loop of aluminum wire, lying flat in a plane, has an
area of 7.80...
asked 2 minutes ago -
A fair die is rolled. What is the probability of the dice coming
up a one...
asked 6 minutes ago -
a)
The following table shows the profile, by the math section of
the SAT Reasoning Test,...
asked 10 minutes ago -
A car drives over the crest of a hill of radius 120m with a
speed of...
asked 25 minutes ago -
Implementation of a MapReduce-style distributed word count
application
For this assignment, you can use any programming...
asked 33 minutes ago -
In females, the labia swells and the vagin-a lubricates during
which phase of the sexual response...
asked 1 hour ago -
2. An item costs a retailer $200. If a 30 percent markup is
desired, what should...
asked 1 hour ago -
Your client, Anita, is hurt in a car accident and comes to you
for some advice....
asked 1 hour ago -
how many mL of 0.1050 M NaOH is needed to reach a pH of 3.74
when...
asked 1 hour ago -
QUESTION
Memory retrieval that is easier when the person is in the same
psychological condition during...
asked 1 hour ago -
The mean annual inflation rate in the UNited States over the
past 98 years in 3.37%...
asked 1 hour ago -
Design a class Holiday that represents a
holiday during the year. This class has three
private...
asked 1 hour ago