(1)

(2)
(3)

(4)

Teacher asked me to give an explanation below each picture. Since I am not a good writer, could someone please help me to write a brief statement of each picture according to the order of 1 to 4 one by one, thank you!
See these pictures and describe and explain these pictures ,write something about each picture similar to elementary school composition.
Homework Answers
1. Employee Billing Rate Demographics
Observations:
All the distributions show alomost a flat level with very less
fluctuation representing a bell curve. This suggests that there is
a good stability in the current rate demographics.
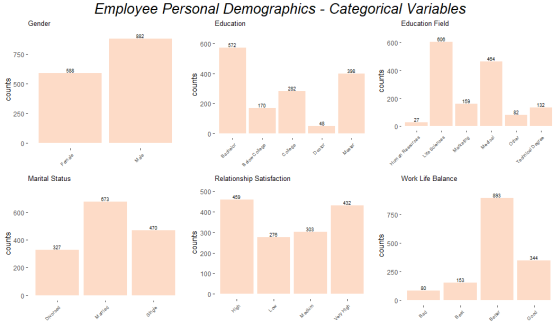
2. Employee Personal Demographics
Observations:
1. Based on the gender graph, there is a good balance in gender of
employees yet more female employee hiring could be
encouraged.
2. The education graph shows that amng the employees, the majority
of them are Bachelors where is Masters degree holders are about 50%
of the Bachelors. THe sum of all other education categories equals
to the count of Bachelor category. Based on the organisation and
requirement, the recruitment process cab be altered.
3. The Education field depicts that the hghest number of employees
belong to LifeSciences and Medical while other fields are
comparatively lesser. Again this depends on the type of
organisation and work requiement.
4. Marital status graph shows that about 50% of emplyees are
Married while 20% are divorced and about 30% are single. This is
good balance.
5. Relationship satisfaction shows good percentage of employees
happy with their relationship but the unsatisfied percentage is
almost nearer.
6. Work-life balance graph shows that there is good feedback from
the employees which is a constructive point for an organisation.
The numbers on bad scale could be reduced by good interaction with
employees and hearing out their complaints and needs in a periodic
time.
3. Employee Work Demographics
Observations:
1. Business travel graph presents that most of the employees travel
rarely and very do not travel or travel frequently. This again
depends on the type of workan employee is assigned.
2. Evironment satisfaction is positive among the employees but
there may be some points, the employees might feel to add to
improve the workplace.
3. Job Involvement plays a kep aspect in the growth of the
organisation and based on the graph, there is good involment from
the employees. Few to very less employees feel off the work. This
can be rectified by managing the plan of the work hours and
appropriate work based on skill and requirement.
4. Job satisfaction shows similar response as of Environment and
Involvement, which is fair enough as they are corelated. Hence can
be improved by the same way.
5. 70% employees don't do overtime while the 25% do overtime. If
the output is to be increased, overtime can be increased with
considerable increase in allowance and facilities.
6. Performance rating corresponds to the other graphs with majority
with Excellent rating and very less in Outstanding rating.
4. Department and Job Role
Observations:
1. Department - Almost 70% of the employees are in Research and
development while considerable amount of employees do the sales.
The HR percent is in balance with the organisation strength but can
be increased to have better management of the resources.
2. The job role graph shows good distribution of the employees
among the various job roles. The maximum employees being in Sales
Executive role with the least in Human Resources. Sales
representative count could be increased a bit to have good output
which contrasts the Healthcase representatives with higher
count.
Please click like button if you love the answer.
Leave a comment for any related queries/doubt.
Thanks.
Add Answer to:
(1)
(2)
(3)
(4)
Teacher asked me to give an explanation below each picture.
Since I...
I need a written explanation for the following questions. Pad 2:10 AM * 100% Econ 2201...
 I need a written explanation for the following questions.
Pad 2:10 AM * 100% Econ 2201 Professor Greenberg HW #9 1) Imagine a one-shot, three-player, sequential game between two firms in an oligopoly market and a third firm which is considering joining the market. The first firm can choose to set a low, medium, or high price. The second firm observes the pricing decision of the first firm and has the same three strategies available for their price. Then, based...
I need a written explanation for the following questions.
Pad 2:10 AM * 100% Econ 2201 Professor Greenberg HW #9 1) Imagine a one-shot, three-player, sequential game between two firms in an oligopoly market and a third firm which is considering joining the market. The first firm can choose to set a low, medium, or high price. The second firm observes the pricing decision of the first firm and has the same three strategies available for their price. Then, based...
Table 1.2 1 4 5 6 Average 2 3 Investment A 400 300 500 200 100...
 Table 1.2 1 4 5 6 Average 2 3 Investment A 400 300 500 200 100 - 300 After tax benefits Value of Investment Jan 1 Dec 31 Average 200 ---- 1000 800 900 800 600 700 600 400 500 400 2000 300 100 --- 500 1 4 5 6 Average 2 3 Investment B 200 300 100 400 500 600 350 After tax benefits Value of Investment Jan 1 Dec 31 1000 833 917 833 666 750 666 499...
Select two data values from your raw data – one that is inside of the confidence interval and one that is outside – one must be at the high end of the data and one at the low end – and construct two h...
Select two data values from your raw data – one that is inside of the confidence interval and one that is outside – one must be at the high end of the data and one at the low end – and construct two hypothesis tests, one for each value. One of the tests should be a “less than”, the other should be a “greater than”, depending on the value being tested. Use a 95% level of confidence, and showcase Ho...
Solve 2 ll mobily 6:15 PM HW 1.doc 2 Consider the Prep-town book store problem in...
 Solve 2
ll mobily 6:15 PM HW 1.doc 2 Consider the Prep-town book store problem in the 52% handouts in which the manager must decide how many copies of the required text book for thoughtful thinking seminar. Using the data given in the table below: Considering only orders in units of 10 0 10 20 30 40 50 60 70 0 0 -50 100-150-200-250 300-350 10 0 150 100 50 0-50 -100 -150 200 150 300 250 200 150 100...
Solve 2
ll mobily 6:15 PM HW 1.doc 2 Consider the Prep-town book store problem in the 52% handouts in which the manager must decide how many copies of the required text book for thoughtful thinking seminar. Using the data given in the table below: Considering only orders in units of 10 0 10 20 30 40 50 60 70 0 0 -50 100-150-200-250 300-350 10 0 150 100 50 0-50 -100 -150 200 150 300 250 200 150 100...
please answer question #2 better picture of the question ENGR 3970 Homework Assignment #2, Fall 2019...
 please answer question #2
better picture of the question
ENGR 3970 Homework Assignment #2, Fall 2019 - Due Mon Sep 23 in Class Note: Show all of your work to arrive at a final result. 1) Using the amounts in the table below and an interest rate of 8% compounded annually, determine (a) the equivalent present amount (b) the equivalent annual amount Use the gradient conversion factor, if and where applicable, for full credit. EOY Deposit 1000 1000 1000 1000...
please answer question #2
better picture of the question
ENGR 3970 Homework Assignment #2, Fall 2019 - Due Mon Sep 23 in Class Note: Show all of your work to arrive at a final result. 1) Using the amounts in the table below and an interest rate of 8% compounded annually, determine (a) the equivalent present amount (b) the equivalent annual amount Use the gradient conversion factor, if and where applicable, for full credit. EOY Deposit 1000 1000 1000 1000...
1- Insert in the given order the following values into an intially empty 2-3-4 tree: 100,...
1- Insert in the given order the following values into an intially empty 2-3-4 tree: 100, 200, 300, 400, 500, 600, 700, 110, 120, 130, 800, 750, 690. Show how the tree evolves after each value is inserted. In other words, draw a picture of the tree after each insertion. 2- Insert the same sequence as above into an initially empty red-black tree. Again draw a picture of the tree after each insertion, and indicate which rotations and/or color flips...
2. Gel analysis practice 1) Label in the below picture and indicate the size of each...
 2. Gel analysis practice 1) Label in the below picture and indicate the size of each DNA fragments of samples A, B,C. samples B Marker A 1,200 bp 1,000 bp 900 bp 800 bp 700 bp 600 bp 500 bp ||||||||| | | 400 bp 300 bp 200 bp 100 bp 2) Based on the following RFLP and gel electrophoresis data, which suspect is at the crime scene? Crime soon Suspect Suspect Suspect -
Marginal Cost Average Variable Cost Average Total Cost Quantity of Exercise Machines 1 2 3 4...
 Marginal Cost Average Variable Cost Average Total Cost Quantity of Exercise Machines 1 2 3 4 5 6 7 8 9 10 $200 $400 $600 $800 $1,000 $1,200 $1,400 $1,600 $1,800 $2,000 $200 $300 $400 $500 $600 $700 $800 $900 $1000 $1100 $1200 $800 $733.33 $750 $800 $866.67 $942.86 $1025 $1111.11 $1200 The above table shows the costs of a small manufacturer producing different quantities of exercise machines. If the exercise machine market is perfectly competitive and exercise machines cost...
27. Given the following information, what production levels are required during periods 1, 2, and 3 to maintain a f...
 27. Given the following information, what production levels are required during periods 1, 2, and 3 to maintain a finished inventory level of 250 units? Period Forecast 0 1 2 3 500 300 ? 750 Production ? Finished Inventory 150 (a) 500, 300, 750 (b) 550, 550, 550 (c) 600,300,750 250 250 250 (d) 300, 300, 300 (e) 600, 200, 700 28. A bank processed 2500 loan forms in 525 hours. The bank employee earns $18.00 per hour, and each...
Marginal Cost Quantity of Exercise Machines Average Variable Cost Average Total Cost 1 2 3 4...
 Marginal Cost Quantity of Exercise Machines Average Variable Cost Average Total Cost 1 2 3 4 5 6 7 8 9 10 $200 $400 $600 $800 $1,000 $1,200 $1,400 $1,600 $1,800 $2,000 $200 $300 $400 $500 $600 $700 $800 $900 $1000 $1100 $1200 $800 $733.33 $750 $800 $866.67 $942.86 $1025 $1111.11 $1200 The above table shows the costs of a small manufacturer producing different quantities of exercise machines. If the exercise machine market is perfectly competitive and exercise machines cost...
 I need a written explanation for the following questions.
Pad 2:10 AM * 100% Econ 2201 Professor Greenberg HW #9 1) Imagine a one-shot, three-player, sequential game between two firms in an oligopoly market and a third firm which is considering joining the market. The first firm can choose to set a low, medium, or high price. The second firm observes the pricing decision of the first firm and has the same three strategies available for their price. Then, based...
I need a written explanation for the following questions.
Pad 2:10 AM * 100% Econ 2201 Professor Greenberg HW #9 1) Imagine a one-shot, three-player, sequential game between two firms in an oligopoly market and a third firm which is considering joining the market. The first firm can choose to set a low, medium, or high price. The second firm observes the pricing decision of the first firm and has the same three strategies available for their price. Then, based...
 Table 1.2 1 4 5 6 Average 2 3 Investment A 400 300 500 200 100 - 300 After tax benefits Value of Investment Jan 1 Dec 31 Average 200 ---- 1000 800 900 800 600 700 600 400 500 400 2000 300 100 --- 500 1 4 5 6 Average 2 3 Investment B 200 300 100 400 500 600 350 After tax benefits Value of Investment Jan 1 Dec 31 1000 833 917 833 666 750 666 499...
 Solve 2
ll mobily 6:15 PM HW 1.doc 2 Consider the Prep-town book store problem in the 52% handouts in which the manager must decide how many copies of the required text book for thoughtful thinking seminar. Using the data given in the table below: Considering only orders in units of 10 0 10 20 30 40 50 60 70 0 0 -50 100-150-200-250 300-350 10 0 150 100 50 0-50 -100 -150 200 150 300 250 200 150 100...
Solve 2
ll mobily 6:15 PM HW 1.doc 2 Consider the Prep-town book store problem in the 52% handouts in which the manager must decide how many copies of the required text book for thoughtful thinking seminar. Using the data given in the table below: Considering only orders in units of 10 0 10 20 30 40 50 60 70 0 0 -50 100-150-200-250 300-350 10 0 150 100 50 0-50 -100 -150 200 150 300 250 200 150 100...
 please answer question #2
better picture of the question
ENGR 3970 Homework Assignment #2, Fall 2019 - Due Mon Sep 23 in Class Note: Show all of your work to arrive at a final result. 1) Using the amounts in the table below and an interest rate of 8% compounded annually, determine (a) the equivalent present amount (b) the equivalent annual amount Use the gradient conversion factor, if and where applicable, for full credit. EOY Deposit 1000 1000 1000 1000...
please answer question #2
better picture of the question
ENGR 3970 Homework Assignment #2, Fall 2019 - Due Mon Sep 23 in Class Note: Show all of your work to arrive at a final result. 1) Using the amounts in the table below and an interest rate of 8% compounded annually, determine (a) the equivalent present amount (b) the equivalent annual amount Use the gradient conversion factor, if and where applicable, for full credit. EOY Deposit 1000 1000 1000 1000...
 2. Gel analysis practice 1) Label in the below picture and indicate the size of each DNA fragments of samples A, B,C. samples B Marker A 1,200 bp 1,000 bp 900 bp 800 bp 700 bp 600 bp 500 bp ||||||||| | | 400 bp 300 bp 200 bp 100 bp 2) Based on the following RFLP and gel electrophoresis data, which suspect is at the crime scene? Crime soon Suspect Suspect Suspect -
 Marginal Cost Average Variable Cost Average Total Cost Quantity of Exercise Machines 1 2 3 4 5 6 7 8 9 10 $200 $400 $600 $800 $1,000 $1,200 $1,400 $1,600 $1,800 $2,000 $200 $300 $400 $500 $600 $700 $800 $900 $1000 $1100 $1200 $800 $733.33 $750 $800 $866.67 $942.86 $1025 $1111.11 $1200 The above table shows the costs of a small manufacturer producing different quantities of exercise machines. If the exercise machine market is perfectly competitive and exercise machines cost...
 27. Given the following information, what production levels are required during periods 1, 2, and 3 to maintain a finished inventory level of 250 units? Period Forecast 0 1 2 3 500 300 ? 750 Production ? Finished Inventory 150 (a) 500, 300, 750 (b) 550, 550, 550 (c) 600,300,750 250 250 250 (d) 300, 300, 300 (e) 600, 200, 700 28. A bank processed 2500 loan forms in 525 hours. The bank employee earns $18.00 per hour, and each...
 Marginal Cost Quantity of Exercise Machines Average Variable Cost Average Total Cost 1 2 3 4 5 6 7 8 9 10 $200 $400 $600 $800 $1,000 $1,200 $1,400 $1,600 $1,800 $2,000 $200 $300 $400 $500 $600 $700 $800 $900 $1000 $1100 $1200 $800 $733.33 $750 $800 $866.67 $942.86 $1025 $1111.11 $1200 The above table shows the costs of a small manufacturer producing different quantities of exercise machines. If the exercise machine market is perfectly competitive and exercise machines cost...
Most questions answered within 3 hours.
-
A 8.15- g bullet from a 9-mm pistol has a velocity of 366.0 m/s.
It strikes...
asked 33 minutes ago -
The outstanding bonds of Alpha Extracts have a yield to maturity
of 7.4 percent and a...
asked 30 minutes ago -
The Problem: The Case of the Harmonizing Vacations
Your CEO is exploring partnering with a European...
asked 1 hour ago -
A chemical equation is balanced by adding coefficients in front
of some formulas so that the...
asked 1 hour ago -
From the literature (reference your sources): What are the
lattice parameters of calcite and aragonite? Why...
asked 2 hours ago -
Your system is rejecting the question am asking which is
preceded by a case study. It...
asked 2 hours ago -
3. On January 2, 2000, Larry creates a trust with himself as
trustee. Larry as trustee...
asked 2 hours ago -
A member of the volleyball team spikes the ball. During this
process, she changes the velocity...
asked 2 hours ago -
Are adult gamers less likely to use a gaming console (Xbox,
PlayStation, Wii, etc...) than teen...
asked 3 hours ago -
The University of
Texas recently reported that 43% of college students aged 18-24
would spend their...
asked 3 hours ago -
The length of stay at a specific emergency department in
Phoenix, Arizona, in 2009 had a...
asked 3 hours ago -
. Please give the mechanism for this type of problem. Step by
Step
The toxin that...
asked 3 hours ago