


Homework Answers
ANSWER:
Step 1: Populations, Distribution, and Assumptions
Population 1: free throws prior to working with Chip
Population 2: free throws after working with Chip
Distribution: t distribution with degrees of freedom = 5 - 1 = 4
Hypothesis test to be used (Explain): Practicing with Chip increased their free throw making abilities
Step 2: Hypotheses
Research Hypothesis: Practicing with Chip increased their free throw making abilities
Symbolic Research Hypothesis: \mu _{D} < 0
Null Hypothesis: Practicing with Chip did not increase their free throw making abilities
Symbolic Null Hypothesis: \mu _{D}\geq 0
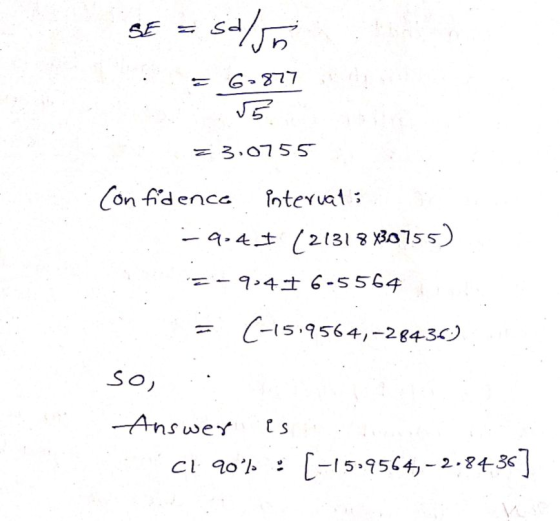
Step 3: Characteristics of the Comparison Distribution (6 points)
Um (mean of means) = \bar{d}=-9.4
SM= sd = 6.877
| # | |||||
| 1 | 90-94=-4 | ||||
| 2 | 77-82=-5 | ||||
| 3 | 64-85=-21 | ||||
| 4 | 87-97=-10 | ||||
| 5 | 88-95=-7 |

Add Answer to:
please please help, i'll give you thumbs up :)
Paired Samples t-test Gregg Popovich, head coach...
help please :) Single Sample t-Test Coach Brown is training his runners for an upcoming race,...
 help please :)
Single Sample t-Test Coach Brown is training his runners for an upcoming race, but he is concerned about their pace He takes down sample times from his top 7 runners to compare it to his all-time standard race speed of 7.9 minutes per kilometer (). The sample times from his runners were 8.55 minutes per kilometer (M) with a standard deviation estimate of 0.78 (s). Based on this data, complete the six steps of hypothesis testing given...
help please :)
Single Sample t-Test Coach Brown is training his runners for an upcoming race, but he is concerned about their pace He takes down sample times from his top 7 runners to compare it to his all-time standard race speed of 7.9 minutes per kilometer (). The sample times from his runners were 8.55 minutes per kilometer (M) with a standard deviation estimate of 0.78 (s). Based on this data, complete the six steps of hypothesis testing given...
Single Sample t-Test Coach Brown is training his runners for an upcoming race, but he is...
Single Sample t-Test Coach Brown is training his runners for an upcoming race, but he is concerned about their pace. He takes down sample times from his top 7 runners to compare it to his all-time standard race speed of 7.9 minutes per kilometer (μ). The sample times from his runners were 8.55 minutes per kilometer (M) with a standard deviation estimate of 0.78 (s). Based on this data, complete the six steps of hypothesis testing given that our research...
Conduct an independent samples t-test (a.k.a., between-subjects design). Each sample should have at least n=8 indivi...
 Conduct an independent samples t-test (a.k.a., between-subjects design). Each sample should have at least n=8 individuals. What to turn in: 1. What is your research question? 2. State the null (Ho) and alternative (H1) hypotheses. 3. Conduct the hypothesis test using an alpha level of .05, and state your conclusion (Reject Ho/Fail to Reject Ho) regarding the original hypotheses. 4. Calculate and interpret a measure of effect size (est. Cohen's d or r2) and a 95% confidence interval.
data Conduct an independent samples t-test (a.k.a., between-subjects design). Each sample should have at least n=8...
 data
Conduct an independent samples t-test (a.k.a., between-subjects design). Each sample should have at least n=8 individuals. What to turn in: 1. What is your research question? 2. State the null (Ho) and alternative (H1) hypotheses. 3. Conduct the hypothesis test using an alpha level of .05, and state your conclusion (Reject Ho/Fail to Reject Ho) regarding the original hypotheses. 4. Calculate and interpret a measure of effect size (est. Cohen's d or r2) and a 95% confidence interval. Subject...
data
Conduct an independent samples t-test (a.k.a., between-subjects design). Each sample should have at least n=8 individuals. What to turn in: 1. What is your research question? 2. State the null (Ho) and alternative (H1) hypotheses. 3. Conduct the hypothesis test using an alpha level of .05, and state your conclusion (Reject Ho/Fail to Reject Ho) regarding the original hypotheses. 4. Calculate and interpret a measure of effect size (est. Cohen's d or r2) and a 95% confidence interval. Subject...
Data Conduct an independent samples t-test (a.k.a., between-subjects design). Each sample should have at least n...
 Data
Conduct an independent samples t-test (a.k.a., between-subjects design). Each sample should have at least n=8 individuals. What to turn in: 1. What is your research question? 2. State the null (Ho) and alternative (H1) hypotheses. 3. Conduct the hypothesis test using an alpha level of .05, and state your conclusion (Reject Ho/Fail to Reject Ho) regarding the original hypotheses. 4. Calculate and interpret a measure of effect size (est. Cohen's d or r2) and a 95% confidence interval. Subject...
Data
Conduct an independent samples t-test (a.k.a., between-subjects design). Each sample should have at least n=8 individuals. What to turn in: 1. What is your research question? 2. State the null (Ho) and alternative (H1) hypotheses. 3. Conduct the hypothesis test using an alpha level of .05, and state your conclusion (Reject Ho/Fail to Reject Ho) regarding the original hypotheses. 4. Calculate and interpret a measure of effect size (est. Cohen's d or r2) and a 95% confidence interval. Subject...
NEED HELP ASAP - will give thumbs up Multi part question set If you can’t finish...
 NEED HELP ASAP - will give thumbs up
Multi part question set
If you can’t finish all of it, that’s ok!
Would really appreciate any and all help as soon as
possible
Thank you so much in advance!
Thank you!! Diversity - 1, MULTIPLE CHOICE There are 14 questions in this set. As you proceed through these questions, use necessary information in the previous questions. Recent research shows that diversity is correlated with profitability ("The Business Case for More Diversity",...
NEED HELP ASAP - will give thumbs up
Multi part question set
If you can’t finish all of it, that’s ok!
Would really appreciate any and all help as soon as
possible
Thank you so much in advance!
Thank you!! Diversity - 1, MULTIPLE CHOICE There are 14 questions in this set. As you proceed through these questions, use necessary information in the previous questions. Recent research shows that diversity is correlated with profitability ("The Business Case for More Diversity",...
Q2) Paired-Samples t Test (14 points) A research project has been tracking the health and cognitive...
 Q2) Paired-Samples t Test (14 points) A research project has been tracking the health and cognitive functions of the elderly population in Arizona. The table below shows the memory test scores from 10 elderly residents, tested first when they were 65 years old and again when they were 75 years old. The researcher wants to know if there is a significant decline in memory functions from age 65 to age 75 based on this sample. In other words, it is...
Q2) Independent-Samples t-Test (15 points total) Help with H, I, J, K, L please! In a...
Q2) Independent-Samples t-Test (15 points total) Help with H, I, J, K, L please! In a research project, researchers collected demographic and health data from a sample of elderly residents in the community. To examine any possible gender differences in their sample, they want to see if the females and the males differ significantly on the education level (number of years of formal schooling). The researchers are not predicting any direction in the possible gender differences so the hypotheses should...
Independent Samples t-test (Worth 15 points) Scenario: An article in the journal Applied Nutritional Investigation reported...
 Independent Samples t-test (Worth 15 points) Scenario: An article in the journal Applied Nutritional Investigation reported the results of a comparison of two different weight-loss programs (Liao, 2007). In the study, obese participants were randomly assigned to one of two groups: (1) the soy group, a low-calorie group that ate only soy-based proteins or (2) the traditional group, a low-calorie group that received 2/3 of their protein from animal products and 1/3 from plant products. One of the dependent measures...
 help please :)
Single Sample t-Test Coach Brown is training his runners for an upcoming race, but he is concerned about their pace He takes down sample times from his top 7 runners to compare it to his all-time standard race speed of 7.9 minutes per kilometer (). The sample times from his runners were 8.55 minutes per kilometer (M) with a standard deviation estimate of 0.78 (s). Based on this data, complete the six steps of hypothesis testing given...
help please :)
Single Sample t-Test Coach Brown is training his runners for an upcoming race, but he is concerned about their pace He takes down sample times from his top 7 runners to compare it to his all-time standard race speed of 7.9 minutes per kilometer (). The sample times from his runners were 8.55 minutes per kilometer (M) with a standard deviation estimate of 0.78 (s). Based on this data, complete the six steps of hypothesis testing given...
 Conduct an independent samples t-test (a.k.a., between-subjects design). Each sample should have at least n=8 individuals. What to turn in: 1. What is your research question? 2. State the null (Ho) and alternative (H1) hypotheses. 3. Conduct the hypothesis test using an alpha level of .05, and state your conclusion (Reject Ho/Fail to Reject Ho) regarding the original hypotheses. 4. Calculate and interpret a measure of effect size (est. Cohen's d or r2) and a 95% confidence interval.
 data
Conduct an independent samples t-test (a.k.a., between-subjects design). Each sample should have at least n=8 individuals. What to turn in: 1. What is your research question? 2. State the null (Ho) and alternative (H1) hypotheses. 3. Conduct the hypothesis test using an alpha level of .05, and state your conclusion (Reject Ho/Fail to Reject Ho) regarding the original hypotheses. 4. Calculate and interpret a measure of effect size (est. Cohen's d or r2) and a 95% confidence interval. Subject...
data
Conduct an independent samples t-test (a.k.a., between-subjects design). Each sample should have at least n=8 individuals. What to turn in: 1. What is your research question? 2. State the null (Ho) and alternative (H1) hypotheses. 3. Conduct the hypothesis test using an alpha level of .05, and state your conclusion (Reject Ho/Fail to Reject Ho) regarding the original hypotheses. 4. Calculate and interpret a measure of effect size (est. Cohen's d or r2) and a 95% confidence interval. Subject...
 Data
Conduct an independent samples t-test (a.k.a., between-subjects design). Each sample should have at least n=8 individuals. What to turn in: 1. What is your research question? 2. State the null (Ho) and alternative (H1) hypotheses. 3. Conduct the hypothesis test using an alpha level of .05, and state your conclusion (Reject Ho/Fail to Reject Ho) regarding the original hypotheses. 4. Calculate and interpret a measure of effect size (est. Cohen's d or r2) and a 95% confidence interval. Subject...
Data
Conduct an independent samples t-test (a.k.a., between-subjects design). Each sample should have at least n=8 individuals. What to turn in: 1. What is your research question? 2. State the null (Ho) and alternative (H1) hypotheses. 3. Conduct the hypothesis test using an alpha level of .05, and state your conclusion (Reject Ho/Fail to Reject Ho) regarding the original hypotheses. 4. Calculate and interpret a measure of effect size (est. Cohen's d or r2) and a 95% confidence interval. Subject...
 NEED HELP ASAP - will give thumbs up
Multi part question set
If you can’t finish all of it, that’s ok!
Would really appreciate any and all help as soon as
possible
Thank you so much in advance!
Thank you!! Diversity - 1, MULTIPLE CHOICE There are 14 questions in this set. As you proceed through these questions, use necessary information in the previous questions. Recent research shows that diversity is correlated with profitability ("The Business Case for More Diversity",...
NEED HELP ASAP - will give thumbs up
Multi part question set
If you can’t finish all of it, that’s ok!
Would really appreciate any and all help as soon as
possible
Thank you so much in advance!
Thank you!! Diversity - 1, MULTIPLE CHOICE There are 14 questions in this set. As you proceed through these questions, use necessary information in the previous questions. Recent research shows that diversity is correlated with profitability ("The Business Case for More Diversity",...
 Q2) Paired-Samples t Test (14 points) A research project has been tracking the health and cognitive functions of the elderly population in Arizona. The table below shows the memory test scores from 10 elderly residents, tested first when they were 65 years old and again when they were 75 years old. The researcher wants to know if there is a significant decline in memory functions from age 65 to age 75 based on this sample. In other words, it is...
 Independent Samples t-test (Worth 15 points) Scenario: An article in the journal Applied Nutritional Investigation reported the results of a comparison of two different weight-loss programs (Liao, 2007). In the study, obese participants were randomly assigned to one of two groups: (1) the soy group, a low-calorie group that ate only soy-based proteins or (2) the traditional group, a low-calorie group that received 2/3 of their protein from animal products and 1/3 from plant products. One of the dependent measures...
Most questions answered within 3 hours.
-
A man is standing 3.40 m in front of a convex spherical mirror
of radius of...
asked 1 minute ago -
Match the annual percentage rate to each of these trade credit
terms:
__ 1/5, NET 60...
asked 2 minutes ago -
ORGANIC CHEMISTRY QUESTION 5
PART A--------
Describe a chemical test for the identification of a double...
asked 3 hours ago -
Both Terence and Tong work at a local actuarial consulting firm
in Des Moines.
Terence arrives...
asked 4 hours ago -
QUESTION 11
. THE RESTING POTENTIAL IS CAUSED BY
.
. A.
. the rotation of...
asked 4 hours ago -
Need them in c++
1. Give the code for the
definition of a node for
the linked implementation of
a tree that contains...
asked 3 hours ago -
For sputtering-cleaning and sputter-depositing a metal,
would you use an AC or DC plasma? Explain your...
asked 3 hours ago -
Defend ONE of the following statements:
Prices should reflect the value consumers are willing to
pay....
asked 4 hours ago -
A magnet of mass 0.10 kg is dropped from rest and falls
vertically through a 20.0...
asked 3 hours ago -
A friend approaches you about a nutritional product and ask you
if it is worth it....
asked 4 hours ago -
What is bacterial transformation? What are the differences and
similarities between transforming a bacterial cell with...
asked 4 hours ago -
A wire loop 20 cm high is dipped in soap solution and then held
vertically to...
asked 4 hours ago