

Homework Answers


Add Answer to:
help please :)
Single Sample t-Test Coach Brown is training his runners for an upcoming race,...
Single Sample t-Test Coach Brown is training his runners for an upcoming race, but he is...
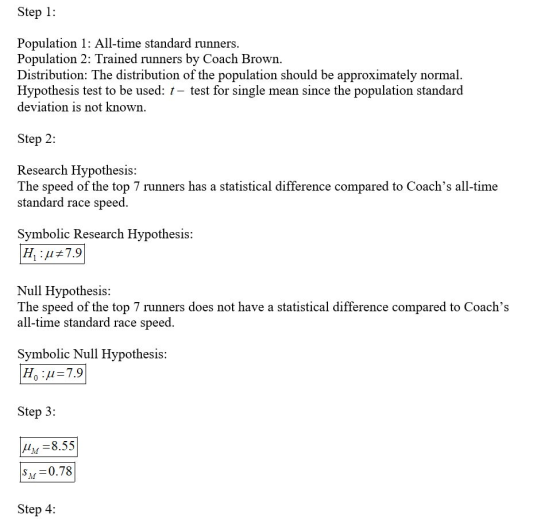
Single Sample t-Test Coach Brown is training his runners for an upcoming race, but he is concerned about their pace. He takes down sample times from his top 7 runners to compare it to his all-time standard race speed of 7.9 minutes per kilometer (μ). The sample times from his runners were 8.55 minutes per kilometer (M) with a standard deviation estimate of 0.78 (s). Based on this data, complete the six steps of hypothesis testing given that our research...
Single Sample t-Test Coach Brown is training his runners for an upcoming race, but he is...
Single Sample t-Test Coach Brown is training his runners for an upcoming race, but he is concerned about their pace. He takes down sample times from his top 7 runners to compare it to his all-time standard race speed of 7.9 minutes per kilometer (μ). The sample times from his runners were 8.55 minutes per kilometer (M) with a standard deviation estimate of 0.78 (s). Based on this data, complete the six steps of hypothesis testing given that our research...
please please help, i'll give you thumbs up :) Paired Samples t-test Gregg Popovich, head coach...
 please please help, i'll give you thumbs up :)
Paired Samples t-test Gregg Popovich, head coach of the San Antonio Spurs, had his top five scorers practice during the past week with the shooting coach Chip Engelland. They shot 100 free throws prior to working with Chip and then shot 100 free throws after working with Chip. Below are the total number of free throws made before and after working with Chip Engelland. Popovich wants to know if practicing with...
please please help, i'll give you thumbs up :)
Paired Samples t-test Gregg Popovich, head coach of the San Antonio Spurs, had his top five scorers practice during the past week with the shooting coach Chip Engelland. They shot 100 free throws prior to working with Chip and then shot 100 free throws after working with Chip. Below are the total number of free throws made before and after working with Chip Engelland. Popovich wants to know if practicing with...
this is a single sample t test problem this is math Assignment #11 Single Sample t-Test...
 this is a single sample t test problem
this is math
Assignment #11 Single Sample t-Test What factor determines whether you should use a z-test or a t-test statistic for a hypothesis test? 11.1 A sample is selected from a population mean of u 30. A treatment is administered to the individuals in the sample and, after treatment, the sample mean found to be M 11.2 = 31.3 with a sample variance of s2 9 If the sample consists of...
this is a single sample t test problem
this is math
Assignment #11 Single Sample t-Test What factor determines whether you should use a z-test or a t-test statistic for a hypothesis test? 11.1 A sample is selected from a population mean of u 30. A treatment is administered to the individuals in the sample and, after treatment, the sample mean found to be M 11.2 = 31.3 with a sample variance of s2 9 If the sample consists of...
Please show all work (using a t-test), thank you. 2. You are the manager of a...
 Please show all work (using a t-test), thank you.
2. You are the manager of a restaurant that delivers pizza to college dormitory rooms. You have just changed your delivery process in an effort to reduce the mean time between the order and the completion of delivery from the current 25 minutes. A sample of 36 orders using the new delivery process yields a sample mean of 22.4 minutes and a sample standard deviation of 6 minutes. What are the...
Please show all work (using a t-test), thank you.
2. You are the manager of a restaurant that delivers pizza to college dormitory rooms. You have just changed your delivery process in an effort to reduce the mean time between the order and the completion of delivery from the current 25 minutes. A sample of 36 orders using the new delivery process yields a sample mean of 22.4 minutes and a sample standard deviation of 6 minutes. What are the...
STEP 1 State the null and alternative hypotheses. STEP 2 Find the value of the test...
 STEP 1 State the null and alternative hypotheses.
STEP 2 Find the value of the test statistic.
STEP 3 Specify if the test is one-tailed or two-tailed
STEP 4 Determine the decision rule for rejecting the null
hypothesis. (Reject H0 if t > )
STEP 5 Make the decision to reject or fail to reject the null
hypothesis
The director of research and development is testing a new medicine. She wants to know if there is evidence at the 0.1...
STEP 1 State the null and alternative hypotheses.
STEP 2 Find the value of the test statistic.
STEP 3 Specify if the test is one-tailed or two-tailed
STEP 4 Determine the decision rule for rejecting the null
hypothesis. (Reject H0 if t > )
STEP 5 Make the decision to reject or fail to reject the null
hypothesis
The director of research and development is testing a new medicine. She wants to know if there is evidence at the 0.1...
The director of research and development is testing a new drug. She wants to know if...
The director of research and development is testing a new drug. She wants to know if there is evidence at the 0.05 level that the drug stays in the system for more than 314 minutes. For a sample of 7 patients, the average time the drug stayed in the system was 319 minutes with a standard deviation of 21. Assume the population distribution is approximately normal. Step 1 of 5: State the null and alternative hypotheses. Step 2 of 5:...
PLEASE help ?? A researcher conducted a single sample t-test on results of an experiment with...
 PLEASE help ??
A researcher conducted a single sample t-test on results of an experiment with n = 18 participants and the computed t = -2.28. What is the correct conclusion from this experiment if p < 0.05, 2-tails test is used for hypothesis testing? O A. The researcher failed to reject the null hypothesis and concluded that there is a significant treatment effect. O B. The researcher rejected the null hypothesis and concluded that there is a significant treatment...
PLEASE help ??
A researcher conducted a single sample t-test on results of an experiment with n = 18 participants and the computed t = -2.28. What is the correct conclusion from this experiment if p < 0.05, 2-tails test is used for hypothesis testing? O A. The researcher failed to reject the null hypothesis and concluded that there is a significant treatment effect. O B. The researcher rejected the null hypothesis and concluded that there is a significant treatment...
Please use a two tailed test and a= .05 for all tests One-sample t-test A researcher...
 Please use a two tailed test and a= .05 for all tests
One-sample t-test A researcher was interested in examining the effect of exercise on happiness levels among college students. The average college student happiness levels is u = 30. A sample of 5 individuals was selected and asked to exercise for three weeks. And then, they were asked to report their happiness scores. Can he conclude that exercise influences happiness levels ? Happiness 37 32 33 36 32 1)...
Please use a two tailed test and a= .05 for all tests
One-sample t-test A researcher was interested in examining the effect of exercise on happiness levels among college students. The average college student happiness levels is u = 30. A sample of 5 individuals was selected and asked to exercise for three weeks. And then, they were asked to report their happiness scores. Can he conclude that exercise influences happiness levels ? Happiness 37 32 33 36 32 1)...
Q1. Hypothesis testing using a Z test (14 points) A professor has been teaching introductory statistics...
Q1. Hypothesis testing using a Z test (14 points) A professor has been teaching introductory statistics for many years and the final exam performance (30 points total) has been very consistent from class to class and the scores have been normally distributed. Overall, the whole data base (i.e. population) of final exam scores has a mean (μ) of 20 points and a standard deviation (σ) of 5 points. Because 20 out of 30 is only about 67%, the professor would...
 please please help, i'll give you thumbs up :)
Paired Samples t-test Gregg Popovich, head coach of the San Antonio Spurs, had his top five scorers practice during the past week with the shooting coach Chip Engelland. They shot 100 free throws prior to working with Chip and then shot 100 free throws after working with Chip. Below are the total number of free throws made before and after working with Chip Engelland. Popovich wants to know if practicing with...
please please help, i'll give you thumbs up :)
Paired Samples t-test Gregg Popovich, head coach of the San Antonio Spurs, had his top five scorers practice during the past week with the shooting coach Chip Engelland. They shot 100 free throws prior to working with Chip and then shot 100 free throws after working with Chip. Below are the total number of free throws made before and after working with Chip Engelland. Popovich wants to know if practicing with...
 this is a single sample t test problem
this is math
Assignment #11 Single Sample t-Test What factor determines whether you should use a z-test or a t-test statistic for a hypothesis test? 11.1 A sample is selected from a population mean of u 30. A treatment is administered to the individuals in the sample and, after treatment, the sample mean found to be M 11.2 = 31.3 with a sample variance of s2 9 If the sample consists of...
this is a single sample t test problem
this is math
Assignment #11 Single Sample t-Test What factor determines whether you should use a z-test or a t-test statistic for a hypothesis test? 11.1 A sample is selected from a population mean of u 30. A treatment is administered to the individuals in the sample and, after treatment, the sample mean found to be M 11.2 = 31.3 with a sample variance of s2 9 If the sample consists of...
 Please show all work (using a t-test), thank you.
2. You are the manager of a restaurant that delivers pizza to college dormitory rooms. You have just changed your delivery process in an effort to reduce the mean time between the order and the completion of delivery from the current 25 minutes. A sample of 36 orders using the new delivery process yields a sample mean of 22.4 minutes and a sample standard deviation of 6 minutes. What are the...
Please show all work (using a t-test), thank you.
2. You are the manager of a restaurant that delivers pizza to college dormitory rooms. You have just changed your delivery process in an effort to reduce the mean time between the order and the completion of delivery from the current 25 minutes. A sample of 36 orders using the new delivery process yields a sample mean of 22.4 minutes and a sample standard deviation of 6 minutes. What are the...
 STEP 1 State the null and alternative hypotheses.
STEP 2 Find the value of the test statistic.
STEP 3 Specify if the test is one-tailed or two-tailed
STEP 4 Determine the decision rule for rejecting the null
hypothesis. (Reject H0 if t > )
STEP 5 Make the decision to reject or fail to reject the null
hypothesis
The director of research and development is testing a new medicine. She wants to know if there is evidence at the 0.1...
STEP 1 State the null and alternative hypotheses.
STEP 2 Find the value of the test statistic.
STEP 3 Specify if the test is one-tailed or two-tailed
STEP 4 Determine the decision rule for rejecting the null
hypothesis. (Reject H0 if t > )
STEP 5 Make the decision to reject or fail to reject the null
hypothesis
The director of research and development is testing a new medicine. She wants to know if there is evidence at the 0.1...
 PLEASE help ??
A researcher conducted a single sample t-test on results of an experiment with n = 18 participants and the computed t = -2.28. What is the correct conclusion from this experiment if p < 0.05, 2-tails test is used for hypothesis testing? O A. The researcher failed to reject the null hypothesis and concluded that there is a significant treatment effect. O B. The researcher rejected the null hypothesis and concluded that there is a significant treatment...
PLEASE help ??
A researcher conducted a single sample t-test on results of an experiment with n = 18 participants and the computed t = -2.28. What is the correct conclusion from this experiment if p < 0.05, 2-tails test is used for hypothesis testing? O A. The researcher failed to reject the null hypothesis and concluded that there is a significant treatment effect. O B. The researcher rejected the null hypothesis and concluded that there is a significant treatment...
 Please use a two tailed test and a= .05 for all tests
One-sample t-test A researcher was interested in examining the effect of exercise on happiness levels among college students. The average college student happiness levels is u = 30. A sample of 5 individuals was selected and asked to exercise for three weeks. And then, they were asked to report their happiness scores. Can he conclude that exercise influences happiness levels ? Happiness 37 32 33 36 32 1)...
Please use a two tailed test and a= .05 for all tests
One-sample t-test A researcher was interested in examining the effect of exercise on happiness levels among college students. The average college student happiness levels is u = 30. A sample of 5 individuals was selected and asked to exercise for three weeks. And then, they were asked to report their happiness scores. Can he conclude that exercise influences happiness levels ? Happiness 37 32 33 36 32 1)...
Most questions answered within 3 hours.
-
An object in front of a concave mirror has a real image that is
11.5 cm...
asked 12 minutes ago -
Consider the reaction, C3 H8 + O2 --> CO2 + H2O. How many
moles of O2...
asked 1 hour ago -
You and your opponent both roll a fair die. If you both roll the
same number,...
asked 2 hours ago -
In a study of the accuracy of fast food drive-through orders,
Restaurant A had 257 accurate...
asked 2 hours ago -
Identify and describe in detail the four categories of
institutions that could be included in a...
asked 2 hours ago -
In python
class Customer:
def __init__(self, customer_id, last_name, first_name, phone_number, address):
self._customer_id = int(customer_id)
self._last_name =...
asked 2 hours ago -
What is an example of a limitation in implementing a new
ERP system and how it...
asked 2 hours ago -
In a section of 9.7cm of an artery with a radius of 2.6mm there
is a...
asked 2 hours ago -
the two carboxylic acid groups of aspartic acid have different
acidities with pKa values of 2.1...
asked 2 hours ago -
Would CuCO3 aqueous salt combined with calcium chloride
form a solid precipitate? If so, what would...
asked 2 hours ago -
How do ECM Solutions assist in embedding a culture of continuous
improvement in an organization? (Project...
asked 2 hours ago -
Directions
These directions introduce the idea of Essential Questions.
Since this may be a new concept...
asked 2 hours ago