
Homework Answers
please rate me high.
Add Answer to:
-/1 POINTS MENDSTAT15 8.4.001. MY NOTES ASK YOUR TEACHER Independent random samples were selected from two...
MY NOTES -/1 POINTS MENDSTAT15 7.5.012. Random samples of size n - were selected from a...
 MY NOTES -/1 POINTS MENDSTAT15 7.5.012. Random samples of size n - were selected from a binomial population with p -0.2. Use the normal distribution to approximate the following probability. (Round your answer to four de P(p < 0 10) = You may need to use the appropriate appendix table or technology to answer this question. MY NOTES 5. -13 POINTS MENDSTAT15 8.3.010. Find the necessary confidence interval for a population mean y for the following values. (Round your answers...
= 40 adults were selected from A small amount of the trace element selenium, 50-200 micrograms...
 = 40 adults were selected from A small amount of the trace element selenium, 50-200 micrograms (ug) per day, is considered essential to good health. Suppose that random samples of n, = n, two regions of the United States and that a day's intake of selenium was recorded for each person. The mean and standard deviation of the selenium daily intakes for the 40 adults from region 1 = 140.5 and s, = 17.1 µg. Find a 95% confidence interval...
A random sample of n = 200 observations from a binomial population produced x = 190...
A random sample of n = 200 observations from a binomial population produced x = 190 successes. Find a 90% confidence interval for p. (Round your answers to three decimal places.) _______ to _______ Interpret the interval. 90% of all values will fall within the interval. There is a 10% chance that an individual sample proportion will fall within the interval. There is a 90% chance that an individual sample proportion will fall within the interval. In repeated sampling, 90%...
A random sample of n = 500 observations from a binomial population produced x = 220...
A random sample of n = 500 observations from a binomial population produced x = 220 successes. (a) Find a point estimate for p. Find the 95% margin of error for your estimator. (Round your answer to three decimal places.) (b) Find a 90% confidence interval for p. (Round your answers to three decimal places.) _____to_____ Interpret this interval. a. In repeated sampling, 10% of all intervals constructed in this manner will enclose the population proportion. b. In repeated sampling,...
Independent random samples were selected from two quantitative populations, with sample sizes, means, and variances given...
Independent random samples were selected from two quantitative populations, with sample sizes, means, and variances given below. Population 1 2 Sample Size 39 44 Sample Mean 9.3 7.3 Sample Variance 8.5 14.82 Construct a 90% confidence interval for the difference in the population means. (Use μ1 − μ2. Round your answers to two decimal places.) __________ to ____________ Construct a 99% confidence interval for the difference in the population means. (Round your answers to two decimal places.) __________ to _____________
Independent random samples were selected from two quantitative populations, with sample sizes, means, and standard deviations...
 Independent random samples were selected from two quantitative populations, with sample sizes, means, and standard deviations given below. n = n2 = 90, x1 = 125.3, %2 = 123.8, s, = 5.7, s, = 6.9 Construct a 95% confidence interval for the difference in the population means ( M M ) (Round your answers to two decimal places.) Find a point estimate for the difference in the population means, Calculate the margin of error. (Round your answer to two decimal...
In order to compare the means of two populations, independent random samples of 395 observations are...
 In order to compare the means of two populations, independent random samples of 395 observations are selected from each population, with the results found in the table to the right. Complete parts a through e below. Sample 2 x2 = 5,250 2-210 Sample 1 X,5,279 1-140 a. Use a 95% confidence interval to estimate the difference between the population means (μ1-μ2) . Interpret the confidence The confidence interval is Round to one decimal place as needed.) Interpret the confidence interval....
1. 0.5/2.5 points| Provious Answers DavoreStat9 7.E.012 My Notes Ask Your Teacher The following observations are...
 1. 0.5/2.5 points| Provious Answers DavoreStat9 7.E.012 My Notes Ask Your Teacher The following observations are lifetimes (days) subsequent to diagnosis for individuals suffering from blood cancer 116 865 182 925 256 984 1025 1062 1063 1165 1191 1222 1222 1251 419 442 461 516 739744 789 B08 1278 1291 135B 1369 1408 1456 1478 1519 1578 1578 1599 16041606 1697 1736 1799 1815 1853 1899 1925 1966 (a) Can a confidence interval for true average lifetime be calculated without...
Check My Work Video Consider the following results for two independent random samples taken from two...
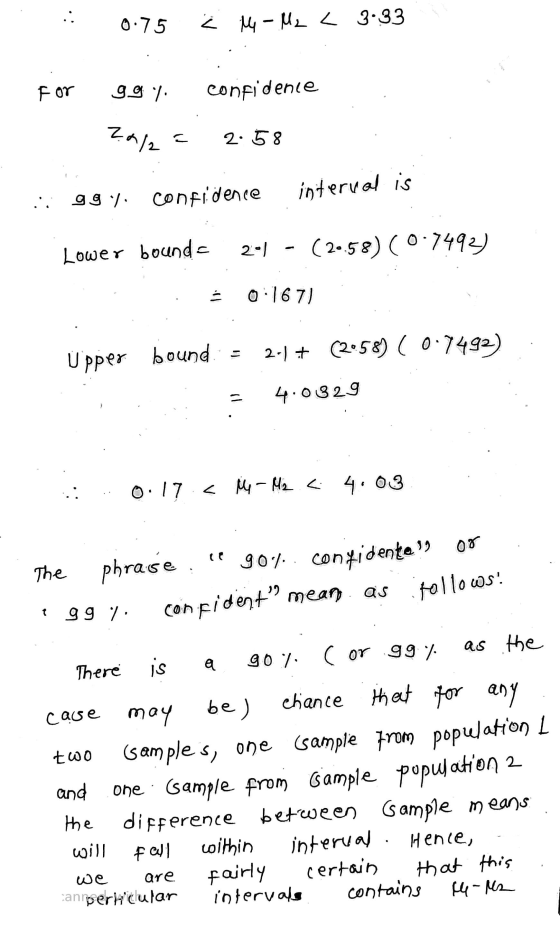
 Check My Work Video Consider the following results for two independent random samples taken from two populations Sample 1 Sample 2 1 40 X1 13. X2 - 11.6 01 = 2.3 a. What is the point estimate of the difference between the two population means? (to 1 decimal) n2=30 02-3.1 1.5 b, provide a 90% confidence interval for the difference between the two population means (to 2 decimals. Use z-table. 89 c, provide a 95% confidence interval for the difference...
Two random samples are selected from two independent populations. A summary of the samples sizes, sample...
Two random samples are selected from two independent populations. A summary of the samples sizes, sample means, and sample standard deviations is given below: n1=51, n2=46, x¯1=57.8, x¯2=75.3, s1=5.2 s2=11 Find a 94.5% confidence interval for the difference μ1−μ2μ1−μ2 of the means, assuming equal population variances. Confidence Interval =
 MY NOTES -/1 POINTS MENDSTAT15 7.5.012. Random samples of size n - were selected from a binomial population with p -0.2. Use the normal distribution to approximate the following probability. (Round your answer to four de P(p < 0 10) = You may need to use the appropriate appendix table or technology to answer this question. MY NOTES 5. -13 POINTS MENDSTAT15 8.3.010. Find the necessary confidence interval for a population mean y for the following values. (Round your answers...
 = 40 adults were selected from A small amount of the trace element selenium, 50-200 micrograms (ug) per day, is considered essential to good health. Suppose that random samples of n, = n, two regions of the United States and that a day's intake of selenium was recorded for each person. The mean and standard deviation of the selenium daily intakes for the 40 adults from region 1 = 140.5 and s, = 17.1 µg. Find a 95% confidence interval...
 Independent random samples were selected from two quantitative populations, with sample sizes, means, and standard deviations given below. n = n2 = 90, x1 = 125.3, %2 = 123.8, s, = 5.7, s, = 6.9 Construct a 95% confidence interval for the difference in the population means ( M M ) (Round your answers to two decimal places.) Find a point estimate for the difference in the population means, Calculate the margin of error. (Round your answer to two decimal...
 In order to compare the means of two populations, independent random samples of 395 observations are selected from each population, with the results found in the table to the right. Complete parts a through e below. Sample 2 x2 = 5,250 2-210 Sample 1 X,5,279 1-140 a. Use a 95% confidence interval to estimate the difference between the population means (μ1-μ2) . Interpret the confidence The confidence interval is Round to one decimal place as needed.) Interpret the confidence interval....
 1. 0.5/2.5 points| Provious Answers DavoreStat9 7.E.012 My Notes Ask Your Teacher The following observations are lifetimes (days) subsequent to diagnosis for individuals suffering from blood cancer 116 865 182 925 256 984 1025 1062 1063 1165 1191 1222 1222 1251 419 442 461 516 739744 789 B08 1278 1291 135B 1369 1408 1456 1478 1519 1578 1578 1599 16041606 1697 1736 1799 1815 1853 1899 1925 1966 (a) Can a confidence interval for true average lifetime be calculated without...
 Check My Work Video Consider the following results for two independent random samples taken from two populations Sample 1 Sample 2 1 40 X1 13. X2 - 11.6 01 = 2.3 a. What is the point estimate of the difference between the two population means? (to 1 decimal) n2=30 02-3.1 1.5 b, provide a 90% confidence interval for the difference between the two population means (to 2 decimals. Use z-table. 89 c, provide a 95% confidence interval for the difference...
Most questions answered within 3 hours.
-
A common laboratory reaction is the neutralization of an acid
with a base. When 41.2 mL...
asked 10 minutes ago -
A solid sphere of radius R and mass 10.0kg is placed on an
incline plane of...
asked 5 minutes ago -
You own a ‘Kiwi-Waffles’ restaurant in Auckland.
‘Kiwi-Waffles’ is a franchise that allows customers to customise...
asked 6 minutes ago -
Given a diploid sexual population of mammals where mutation,
selection and migration do not occur, and...
asked 7 minutes ago -
give anhydrides for the following acids? H3BO3, H3PO4,
HClO4
asked 20 minutes ago -
A beam of light consisting of two wavelengths, 546.0 nm and
409.5 nm, is used to...
asked 20 minutes ago -
Describe the safeguards for the various file systems and assess
how effective they are
asked 25 minutes ago -
Write as assignment statement that assigns WA to an existing
string variable state. Visual Studio 2019....
asked 23 minutes ago -
What is happening to the electron in the tube to make it deflect
more when Vd...
asked 46 minutes ago -
You start with 23.00g of aluminum and 55.00g of NH4ClO4. What is
the limiting reagent? 10Al(s)...
asked 52 minutes ago -
Find the errors in following program.
//This program uses a switch statement to assign a
//...
asked 54 minutes ago -
The mass structure of a spiral galaxy may be determined by
measurement of its___________ ________________
asked 1 hour ago