
Homework Answers
| X | Y | X * Y | X2 | Y2 | |
| 1 | 2 | 2 | 1 | 4 | |
| 2 | 2 | 4 | 4 | 4 | |
| 3 | 5 | 15 | 9 | 25 | |
| 4 | 4 | 16 | 16 | 16 | |
| 5 | 6 | 30 | 25 | 36 | |
| Total | 15 | 19 | 67 | 55 | 85 |
Correlation coefficient is


Part b)
Equation of regression line is 


b = 1
a =( 19 - ( 1 * 15 ) ) / 5
a = 0.8
Equation of regression line becomes 
Slope = 1
Y intercept = 0.8
Part d)
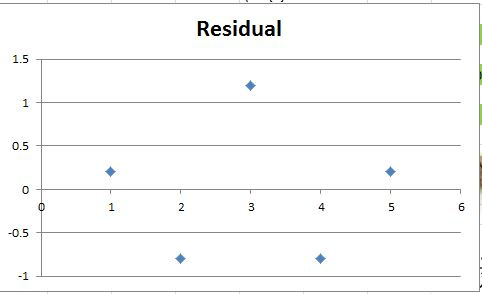
Since the residual plot is random i.e residual does not follow any pattern.
We can say that the model is appropriate to the data.
Add Answer to:
Use the data sct below to answer the following questions a) Compute r(x, y). b) Compute...
3. The following questions are related to a simulated data Y. The least square method was...
 3. The following questions are related to a simulated data Y. The least square method was used to fit a model of the form Ý, 0 + At + t 1, . .200. The regression output, the ACF plot of the standardized residuals (after regressing Y on time) and the code is below. The code is not needed to answer the question a. Estimate the slope and the intercept of the least regression line for the data. b. What percentage...
2. Suppose Y ~ Exp(a), which has pdf f(y)-1 exp(-y/a). (a) Use the following R code to generate data from the model Yi...
 2. Suppose Y ~ Exp(a), which has pdf f(y)-1 exp(-y/a). (a) Use the following R code to generate data from the model Yi ~ Exp(0.05/Xi), and provide the scatterplot of Y against X set.seed(123) n <- 500 <-rnorm (n, x 3, 1) Y <- rexp(n, X) (b) Fit the model Yi-Ao + Ax, + ε¡ using the lm function in R and provide a plot of the best fit line on the scatterplot of Y vs X, and the residual...
Data on the fuel consumption ?y of a car at various speeds ?x is given. Fuel...
Data on the fuel consumption ?y of a car at various speeds ?x is given. Fuel consumption is measured in mpg, and speed is measured in miles per hour. Software tells us that the equation of the least‑squares regression line is ?̂ =55.3286−0.02286?y^=55.3286−0.02286x Using this equation, we can add the residuals to the original data. Speed 1010 2020 3030 4040 5050 6060 7070 8080 Fuel 38.138.1 54.054.0 68.468.4 63.663.6 60.560.5 55.455.4 50.650.6 43.843.8 Residual −17.00−17.00 −0.87−0.87 13.7613.76 9.199.19 6.316.31 1.441.44...
Below are given (a) A scatterplot of Y versus X and (b) A plot of residuals...
 Below are given (a) A scatterplot of Y versus X and (b) A plot
of residuals versus fitted values after a simple linear regression
model was fit to the data. What is the equation of the fitted line?
Discuss what is indicated about the relationship between Y and X as
it relates to simple linear regression.
Fitted Line Plot Y = - 14.64 + 7.431 X R-Sq R-Sq (adj) 2.43700 91.9% 91.8% 1 > 20- 3 4 5 6 7...
Below are given (a) A scatterplot of Y versus X and (b) A plot
of residuals versus fitted values after a simple linear regression
model was fit to the data. What is the equation of the fitted line?
Discuss what is indicated about the relationship between Y and X as
it relates to simple linear regression.
Fitted Line Plot Y = - 14.64 + 7.431 X R-Sq R-Sq (adj) 2.43700 91.9% 91.8% 1 > 20- 3 4 5 6 7...
Complete parts (a) through (h) for the data below. x- 40, 50, 60, 70, 80 y-62,...
Complete parts (a) through (h) for the data below. x- 40, 50, 60, 70, 80 y-62, 58, 55, 47, 33 B) Find the equation of the line containing the points (50, 58) and (80, 33) y=__x+(__) D) By hand, determine the least-squares regression line The equation of the least-squares regression line is given by ModifyingAbove y with caret equals b 1 x plus b 0y=b1x+b0 where b1 equals r times StartFraction s Subscript y Over s Subscript x EndFractionb1=r•sysx is...
Consider the following example of a simple linear regression in R. x = c(-1,0,1) y =...
 Consider the following example of a simple linear regression in R. x = c(-1,0,1) y = c(0,4,2) lm(y"x) ## Call: ## lm(formula = y ~ x) ## Coefficients: # (Intercept) 2 Please write down the design matrix X and compute the values of the slope in the R output (make sure you show the details). Please interpret both intercept and slope in the simple linear regression
Consider the following data for two variables, x and y.
 Consider the following data for two variables, x and y. a. Choose the correct scatter diagram with x and y. The correct scatter diagram is - _______ . Does there appear to be a linear relationship between x and y? Explain. The scatter diagram- Select your answer - some evidence of a possible linear relationship. b. Develop the estimated regression equation relating x and y. Save "predicted" and "residuals" (to 4 decimals). c. Choose the correct scatter diagram or the residuals versus y tor the estimated...
2.3*) Graph the following observations of x and y on graph paper. X 12 3 4...
 2.3*) Graph the following observations of x and y on graph paper. X 12 3 4 5 6 la 10 8 55 23 bole (a) Using a ruler, draw a line that fits through the data. Measure the slope and intercept of the line you have drawn. (b) Use formulas (2.7) and (2.8) to compute, using only a hand calculator, the least squares estimates of the slope and the intercept. Plot this line on your graph. (c) Obtain the sample...
3. Use the data table below to answer the following questions: (a) The least absolute deviation line for the data i...
 3. Use the data table below to answer the following questions: (a) The least absolute deviation line for the data in the table is y - 1.5x +17. What is the sum of the absolute deviations? (b) Find the median-median regression line for the data in the table. (c) Using the equations for the least absolute deviation line and the median-median regression line determine which model does a better job of predicting the y-value for x 11.* 21 20 38...
Group Assignment #8-Linear regression review You have the following sample data for y (dependent ...
 Needs to be done in Matlab
Group Assignment #8-Linear regression review You have the following sample data for y (dependent variable) versus x (independent variable) x [1.1 2.0 3.1 3.9 5.1 6.0 7.3 7.8 9.1 10.4] y [0.8 2.1 2.9 4.3 4.9 5.9 7.0 8.3 8.7 9.9] a. Solve for the regression line and report a and b. b. Plot the regression line overlaid with the sample data points c. Solve for the error term (residuals) and plot residuals vs....
Needs to be done in Matlab
Group Assignment #8-Linear regression review You have the following sample data for y (dependent variable) versus x (independent variable) x [1.1 2.0 3.1 3.9 5.1 6.0 7.3 7.8 9.1 10.4] y [0.8 2.1 2.9 4.3 4.9 5.9 7.0 8.3 8.7 9.9] a. Solve for the regression line and report a and b. b. Plot the regression line overlaid with the sample data points c. Solve for the error term (residuals) and plot residuals vs....
 3. The following questions are related to a simulated data Y. The least square method was used to fit a model of the form Ý, 0 + At + t 1, . .200. The regression output, the ACF plot of the standardized residuals (after regressing Y on time) and the code is below. The code is not needed to answer the question a. Estimate the slope and the intercept of the least regression line for the data. b. What percentage...
 2. Suppose Y ~ Exp(a), which has pdf f(y)-1 exp(-y/a). (a) Use the following R code to generate data from the model Yi ~ Exp(0.05/Xi), and provide the scatterplot of Y against X set.seed(123) n <- 500 <-rnorm (n, x 3, 1) Y <- rexp(n, X) (b) Fit the model Yi-Ao + Ax, + ε¡ using the lm function in R and provide a plot of the best fit line on the scatterplot of Y vs X, and the residual...
 Below are given (a) A scatterplot of Y versus X and (b) A plot
of residuals versus fitted values after a simple linear regression
model was fit to the data. What is the equation of the fitted line?
Discuss what is indicated about the relationship between Y and X as
it relates to simple linear regression.
Fitted Line Plot Y = - 14.64 + 7.431 X R-Sq R-Sq (adj) 2.43700 91.9% 91.8% 1 > 20- 3 4 5 6 7...
Below are given (a) A scatterplot of Y versus X and (b) A plot
of residuals versus fitted values after a simple linear regression
model was fit to the data. What is the equation of the fitted line?
Discuss what is indicated about the relationship between Y and X as
it relates to simple linear regression.
Fitted Line Plot Y = - 14.64 + 7.431 X R-Sq R-Sq (adj) 2.43700 91.9% 91.8% 1 > 20- 3 4 5 6 7...
 Consider the following example of a simple linear regression in R. x = c(-1,0,1) y = c(0,4,2) lm(y"x) ## Call: ## lm(formula = y ~ x) ## Coefficients: # (Intercept) 2 Please write down the design matrix X and compute the values of the slope in the R output (make sure you show the details). Please interpret both intercept and slope in the simple linear regression
 2.3*) Graph the following observations of x and y on graph paper. X 12 3 4 5 6 la 10 8 55 23 bole (a) Using a ruler, draw a line that fits through the data. Measure the slope and intercept of the line you have drawn. (b) Use formulas (2.7) and (2.8) to compute, using only a hand calculator, the least squares estimates of the slope and the intercept. Plot this line on your graph. (c) Obtain the sample...
 3. Use the data table below to answer the following questions: (a) The least absolute deviation line for the data in the table is y - 1.5x +17. What is the sum of the absolute deviations? (b) Find the median-median regression line for the data in the table. (c) Using the equations for the least absolute deviation line and the median-median regression line determine which model does a better job of predicting the y-value for x 11.* 21 20 38...
 Needs to be done in Matlab
Group Assignment #8-Linear regression review You have the following sample data for y (dependent variable) versus x (independent variable) x [1.1 2.0 3.1 3.9 5.1 6.0 7.3 7.8 9.1 10.4] y [0.8 2.1 2.9 4.3 4.9 5.9 7.0 8.3 8.7 9.9] a. Solve for the regression line and report a and b. b. Plot the regression line overlaid with the sample data points c. Solve for the error term (residuals) and plot residuals vs....
Needs to be done in Matlab
Group Assignment #8-Linear regression review You have the following sample data for y (dependent variable) versus x (independent variable) x [1.1 2.0 3.1 3.9 5.1 6.0 7.3 7.8 9.1 10.4] y [0.8 2.1 2.9 4.3 4.9 5.9 7.0 8.3 8.7 9.9] a. Solve for the regression line and report a and b. b. Plot the regression line overlaid with the sample data points c. Solve for the error term (residuals) and plot residuals vs....
Most questions answered within 3 hours.
-
C - Language
Write a loop that sets each array element to the sum of itself...
asked 36 minutes ago -
(63
#14)
which of the following statments best describes how chamging
the concentration of the substances...
asked 4 hours ago -
In the following reaction, which element is undergoing
oxidation: Na2SO3 + N2O --> N2 + Na2SO4...
asked 4 hours ago -
Which of the following pairs of ions have the same electron
configuration?
I: Br− and Se2−...
asked 7 hours ago -
The Foremost Composite Materials Company is planning a two-day
sales conference for October 19-20. The conference...
asked 7 hours ago -
3) Illustrate the observed pattern of relatedness of organisms
versus adaptations to specific conditions. This means...
asked 8 hours ago -
In winter a lake has a 0.35 m thick ice layer over 1.10 m of
water....
asked 9 hours ago -
Assuming the following has been encrypted with a Vigenere cipher
below, use the method(s) and assumptions...
asked 9 hours ago -
How would I use switch statements to write a program that will
take an input of...
asked 9 hours ago -
Imagine a reaction in which methane gas combusts at a constant
pressure of 1 atm and...
asked 9 hours ago -
Two parallel wires (each 12 m in length) are separated by a
distance of 0.065 m...
asked 9 hours ago -
Suppose there were three masses at the corner of uniform
equilateral triangle. The masses are m1...
asked 9 hours ago