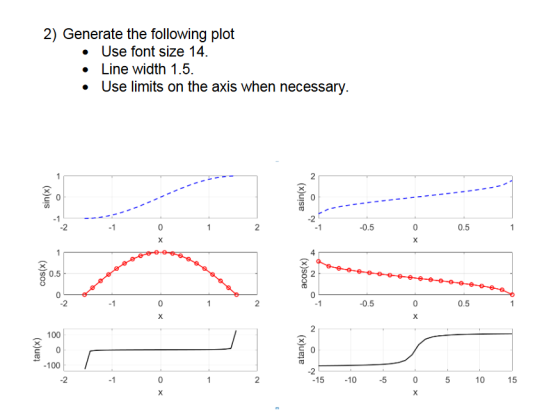
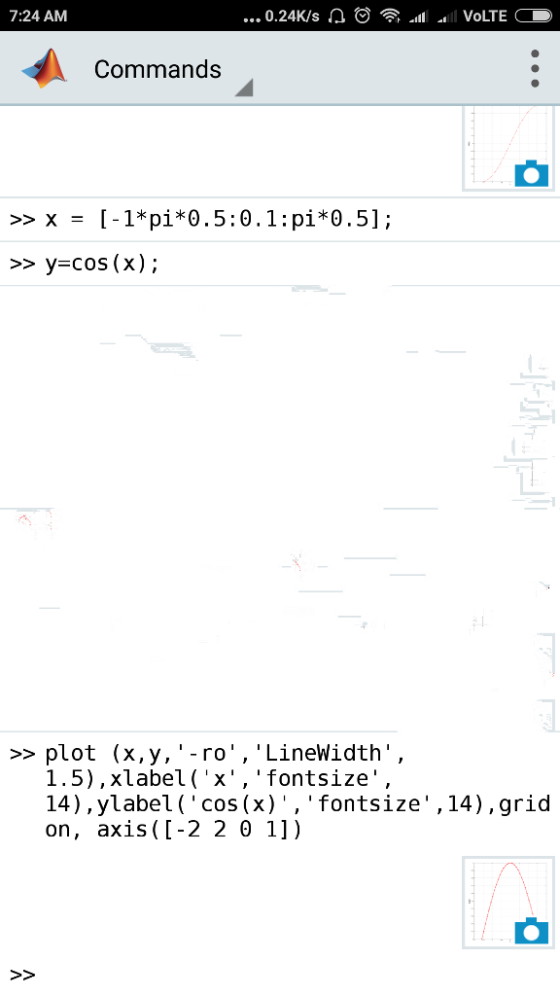
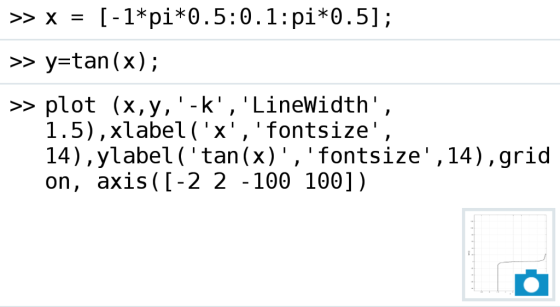
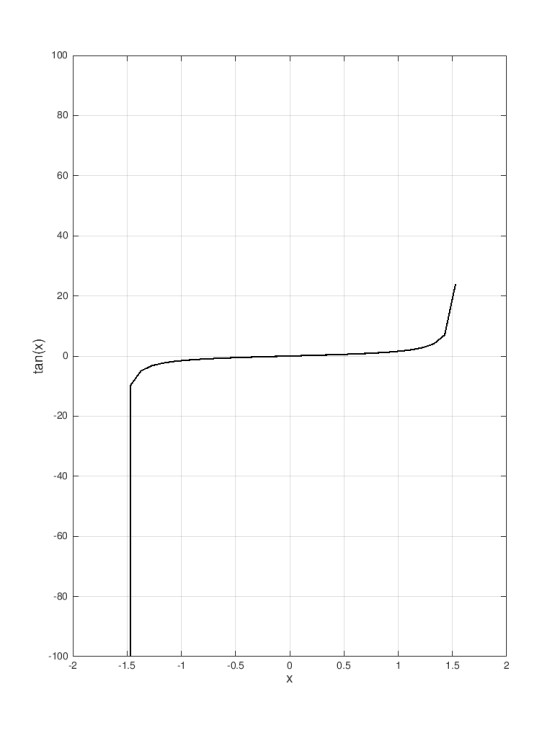
I need some help with this I know you use the subplot
function but I can't get it to work
***MATLAB***
Homework Answers
![>>x-[-1*pi*0.5:0.1:pi*0.5]; >> y-sin(x); >> plot(x,y,--r r, LineWidth 1.5),xlabel (x, fontsize 14),ylabel (sin (x),](http://img.homeworklib.com/questions/3d423860-7dd4-11eb-932d-35b85fce79ad.png?x-oss-process=image/resize,w_560)


Add Answer to:
I need some help with this I know you use the subplot
function but I can't...
Please help me with this MATLAB programming problem! Im coding iin MATLAB2018 if that makes any d...
 Please help me with this MATLAB programming problem! Im coding
iin MATLAB2018 if that makes any difference!
The first picture is the question i need to answer.
The picture below is used as reference to answer the
question.
The last picture (below) is the into to the problem, and is
used as reference.
1. Use Matlab to create the following single plot with three subplots. All titles, gridlines, and axis labels should be as shown. Arc System Response 15 E...
Please help me with this MATLAB programming problem! Im coding
iin MATLAB2018 if that makes any difference!
The first picture is the question i need to answer.
The picture below is used as reference to answer the
question.
The last picture (below) is the into to the problem, and is
used as reference.
1. Use Matlab to create the following single plot with three subplots. All titles, gridlines, and axis labels should be as shown. Arc System Response 15 E...
I know how to do part a but i really need help with part B. Thanks...
 I know how to do part a but i really need help with part B.
Thanks
1. a) Use MATLAB or Excel to create a Bode plot of the transfer function G(S) +0.5 0.5 s 1.0. for 0.0 1 a) 100 b) Discretize the transfer function using a backwards difference (Euler) transformation. Write a routine in MATLAB or Excel to calculate the output of the transfer function given an input signal. Use your routine to calculate the outputs for the...
I know how to do part a but i really need help with part B.
Thanks
1. a) Use MATLAB or Excel to create a Bode plot of the transfer function G(S) +0.5 0.5 s 1.0. for 0.0 1 a) 100 b) Discretize the transfer function using a backwards difference (Euler) transformation. Write a routine in MATLAB or Excel to calculate the output of the transfer function given an input signal. Use your routine to calculate the outputs for the...
Can you please put this is matlab and show the results. I can't get an answer....
 Can you please put this is
matlab and show the results. I can't get an answer.
>> f- inline '10+4*sin (t) -2*sqrt(y) ','t','y').; >>plot(t.y)
Can you please put this is
matlab and show the results. I can't get an answer.
>> f- inline '10+4*sin (t) -2*sqrt(y) ','t','y').; >>plot(t.y)
i need help in this assignment by using matlab. codes only or capture the solutionPlot t...
 i need help in this assignment
by using matlab.
codes only or capture the solutionPlot t versus v with line width 1.5, dotted, red colored line, triangle shaped, marker with size 10, black edge, and green face. A1-2. a. Determine the drae coefficient (cd) using the equation: cd = g*m/upsilon^2from the exploratory data analysis below: g=9.81 b. Find out average, maximum, and minimum of cd by the command meant(cd), max(cd), and min(cd) respectively. c. Determine the predicted terminal velocity by...
i need help in this assignment
by using matlab.
codes only or capture the solutionPlot t versus v with line width 1.5, dotted, red colored line, triangle shaped, marker with size 10, black edge, and green face. A1-2. a. Determine the drae coefficient (cd) using the equation: cd = g*m/upsilon^2from the exploratory data analysis below: g=9.81 b. Find out average, maximum, and minimum of cd by the command meant(cd), max(cd), and min(cd) respectively. c. Determine the predicted terminal velocity by...
1. Plotting a target sign Make a new script called CTask1p1.m to draw a simple target sign, as shown below. You may use sin(), cos() and line() functions, but not viscircles() function. You may use p...
 1. Plotting a target sign Make a new script called CTask1p1.m to draw a simple target sign, as shown below. You may use sin(), cos() and line() functions, but not viscircles() function. You may use plot function's name-value pairs to specify the line width and colour. When specifying colours, you can use the colour names (or colour code), such as 'blue', 'red', instead of providing RGB vector. In addition, you can use axis equa 4 3.5 3 2.5 2 1.5...
Can someone help me out with this. I can't get my MATLAB to do these correctly,...
 Can someone help me out with this. I can't get my MATLAB to do
these correctly, thanks!
Solve the following differential equations using the Matlab function "ode45”, ”ode23” or “ode 15s". For all cases use odeset to set the stats to on, so you can see the process for the solver. Plot your result. Use a legend on your plots. (a) y' =-2y y(0) = 5, tfinal = 2 (b) y" + 3 y' + 25 y = 0 y(0)...
Can someone help me out with this. I can't get my MATLAB to do
these correctly, thanks!
Solve the following differential equations using the Matlab function "ode45”, ”ode23” or “ode 15s". For all cases use odeset to set the stats to on, so you can see the process for the solver. Plot your result. Use a legend on your plots. (a) y' =-2y y(0) = 5, tfinal = 2 (b) y" + 3 y' + 25 y = 0 y(0)...
please use matlab Goal: Solve for the loads of the chain saw under different loading conditions....
 please use matlab
Goal: Solve for the loads of the chain saw under different loading conditions. The loads on a chain saw as it cuts a log can be represented with the following equations: Ar +B -R cos(60) 0 My-W +By - R sin(60)0 Ar is the reaction load in the x-direction at point A (lb) Ay is the reaction load in the y-direction at point A (Ib) W is the weight of the chain saw (lb) R is the...
please use matlab
Goal: Solve for the loads of the chain saw under different loading conditions. The loads on a chain saw as it cuts a log can be represented with the following equations: Ar +B -R cos(60) 0 My-W +By - R sin(60)0 Ar is the reaction load in the x-direction at point A (lb) Ay is the reaction load in the y-direction at point A (Ib) W is the weight of the chain saw (lb) R is the...
I'm trying to solve this problem by using matlab. But I don't know reason why I can't get the solutions. I w...
 I'm
trying to solve this problem by using matlab. But I don't know
reason why I can't get the solutions. I wanna get a plot of this
differential equation. Please find a way how to solve this problem.
May there're errors in the code. Please check it.
second-oder-ode2.m x 曱function, second-oder-ode2 t=0:0.001 :30; initial-× = 0; in i t i al-dxdt 0; lt,影=ode45( @rhs, t. [initial.x initial-dxdt ] ); plot( (:, 1) ) ; xlabel( 't); ylabel(): function dxdt=rhs( t,...
I'm
trying to solve this problem by using matlab. But I don't know
reason why I can't get the solutions. I wanna get a plot of this
differential equation. Please find a way how to solve this problem.
May there're errors in the code. Please check it.
second-oder-ode2.m x 曱function, second-oder-ode2 t=0:0.001 :30; initial-× = 0; in i t i al-dxdt 0; lt,影=ode45( @rhs, t. [initial.x initial-dxdt ] ); plot( (:, 1) ) ; xlabel( 't); ylabel(): function dxdt=rhs( t,...
please help me with this MATLAB CODE and explain to me what each line does and...
 please help me with this MATLAB CODE and
explain to me what each line does and what is used for?
leave your comments as words, not as pictures.
.....................................................................................................................................................................
clear all; close all; % For a script file, you better start with
clear all and close all
% However, for a fucntion, you better NOT to start
% with them
%% End of cell mode example
%% Plot function
t = 0:0.1:5;
x1 = sin(2*5*t); x2 = cos(3*7*t);...
please help me with this MATLAB CODE and
explain to me what each line does and what is used for?
leave your comments as words, not as pictures.
.....................................................................................................................................................................
clear all; close all; % For a script file, you better start with
clear all and close all
% However, for a fucntion, you better NOT to start
% with them
%% End of cell mode example
%% Plot function
t = 0:0.1:5;
x1 = sin(2*5*t); x2 = cos(3*7*t);...
Practice: Plot x vs y when y sin(x), y cosx), y sin (2"x), and y-2 sin(x)...
 Practice: Plot x vs y when y sin(x), y cosx), y sin (2"x), and y-2 sin(x) when x-1:0.1:10. Use 2 by 2 subplot, sin(x) is in location 1, cos(x) is in location 2, sin(2x) is in location 3 and 2 sin(x) is in location 4 The plot should have: (1) x labe|-"х value", y label = 'y value', legend 'y=sin(x)',' y-cos(x)',' y-sin (2*x)', "y-y-2*sin(x), and title = "X Vs. y, under Font Name of Times New Roman, and Font Size...
 Please help me with this MATLAB programming problem! Im coding
iin MATLAB2018 if that makes any difference!
The first picture is the question i need to answer.
The picture below is used as reference to answer the
question.
The last picture (below) is the into to the problem, and is
used as reference.
1. Use Matlab to create the following single plot with three subplots. All titles, gridlines, and axis labels should be as shown. Arc System Response 15 E...
Please help me with this MATLAB programming problem! Im coding
iin MATLAB2018 if that makes any difference!
The first picture is the question i need to answer.
The picture below is used as reference to answer the
question.
The last picture (below) is the into to the problem, and is
used as reference.
1. Use Matlab to create the following single plot with three subplots. All titles, gridlines, and axis labels should be as shown. Arc System Response 15 E...
 I know how to do part a but i really need help with part B.
Thanks
1. a) Use MATLAB or Excel to create a Bode plot of the transfer function G(S) +0.5 0.5 s 1.0. for 0.0 1 a) 100 b) Discretize the transfer function using a backwards difference (Euler) transformation. Write a routine in MATLAB or Excel to calculate the output of the transfer function given an input signal. Use your routine to calculate the outputs for the...
I know how to do part a but i really need help with part B.
Thanks
1. a) Use MATLAB or Excel to create a Bode plot of the transfer function G(S) +0.5 0.5 s 1.0. for 0.0 1 a) 100 b) Discretize the transfer function using a backwards difference (Euler) transformation. Write a routine in MATLAB or Excel to calculate the output of the transfer function given an input signal. Use your routine to calculate the outputs for the...
 Can you please put this is
matlab and show the results. I can't get an answer.
>> f- inline '10+4*sin (t) -2*sqrt(y) ','t','y').; >>plot(t.y)
Can you please put this is
matlab and show the results. I can't get an answer.
>> f- inline '10+4*sin (t) -2*sqrt(y) ','t','y').; >>plot(t.y)
 i need help in this assignment
by using matlab.
codes only or capture the solutionPlot t versus v with line width 1.5, dotted, red colored line, triangle shaped, marker with size 10, black edge, and green face. A1-2. a. Determine the drae coefficient (cd) using the equation: cd = g*m/upsilon^2from the exploratory data analysis below: g=9.81 b. Find out average, maximum, and minimum of cd by the command meant(cd), max(cd), and min(cd) respectively. c. Determine the predicted terminal velocity by...
i need help in this assignment
by using matlab.
codes only or capture the solutionPlot t versus v with line width 1.5, dotted, red colored line, triangle shaped, marker with size 10, black edge, and green face. A1-2. a. Determine the drae coefficient (cd) using the equation: cd = g*m/upsilon^2from the exploratory data analysis below: g=9.81 b. Find out average, maximum, and minimum of cd by the command meant(cd), max(cd), and min(cd) respectively. c. Determine the predicted terminal velocity by...
 1. Plotting a target sign Make a new script called CTask1p1.m to draw a simple target sign, as shown below. You may use sin(), cos() and line() functions, but not viscircles() function. You may use plot function's name-value pairs to specify the line width and colour. When specifying colours, you can use the colour names (or colour code), such as 'blue', 'red', instead of providing RGB vector. In addition, you can use axis equa 4 3.5 3 2.5 2 1.5...
 Can someone help me out with this. I can't get my MATLAB to do
these correctly, thanks!
Solve the following differential equations using the Matlab function "ode45”, ”ode23” or “ode 15s". For all cases use odeset to set the stats to on, so you can see the process for the solver. Plot your result. Use a legend on your plots. (a) y' =-2y y(0) = 5, tfinal = 2 (b) y" + 3 y' + 25 y = 0 y(0)...
Can someone help me out with this. I can't get my MATLAB to do
these correctly, thanks!
Solve the following differential equations using the Matlab function "ode45”, ”ode23” or “ode 15s". For all cases use odeset to set the stats to on, so you can see the process for the solver. Plot your result. Use a legend on your plots. (a) y' =-2y y(0) = 5, tfinal = 2 (b) y" + 3 y' + 25 y = 0 y(0)...
 please use matlab
Goal: Solve for the loads of the chain saw under different loading conditions. The loads on a chain saw as it cuts a log can be represented with the following equations: Ar +B -R cos(60) 0 My-W +By - R sin(60)0 Ar is the reaction load in the x-direction at point A (lb) Ay is the reaction load in the y-direction at point A (Ib) W is the weight of the chain saw (lb) R is the...
please use matlab
Goal: Solve for the loads of the chain saw under different loading conditions. The loads on a chain saw as it cuts a log can be represented with the following equations: Ar +B -R cos(60) 0 My-W +By - R sin(60)0 Ar is the reaction load in the x-direction at point A (lb) Ay is the reaction load in the y-direction at point A (Ib) W is the weight of the chain saw (lb) R is the...
 I'm
trying to solve this problem by using matlab. But I don't know
reason why I can't get the solutions. I wanna get a plot of this
differential equation. Please find a way how to solve this problem.
May there're errors in the code. Please check it.
second-oder-ode2.m x 曱function, second-oder-ode2 t=0:0.001 :30; initial-× = 0; in i t i al-dxdt 0; lt,影=ode45( @rhs, t. [initial.x initial-dxdt ] ); plot( (:, 1) ) ; xlabel( 't); ylabel(): function dxdt=rhs( t,...
I'm
trying to solve this problem by using matlab. But I don't know
reason why I can't get the solutions. I wanna get a plot of this
differential equation. Please find a way how to solve this problem.
May there're errors in the code. Please check it.
second-oder-ode2.m x 曱function, second-oder-ode2 t=0:0.001 :30; initial-× = 0; in i t i al-dxdt 0; lt,影=ode45( @rhs, t. [initial.x initial-dxdt ] ); plot( (:, 1) ) ; xlabel( 't); ylabel(): function dxdt=rhs( t,...
 please help me with this MATLAB CODE and
explain to me what each line does and what is used for?
leave your comments as words, not as pictures.
.....................................................................................................................................................................
clear all; close all; % For a script file, you better start with
clear all and close all
% However, for a fucntion, you better NOT to start
% with them
%% End of cell mode example
%% Plot function
t = 0:0.1:5;
x1 = sin(2*5*t); x2 = cos(3*7*t);...
please help me with this MATLAB CODE and
explain to me what each line does and what is used for?
leave your comments as words, not as pictures.
.....................................................................................................................................................................
clear all; close all; % For a script file, you better start with
clear all and close all
% However, for a fucntion, you better NOT to start
% with them
%% End of cell mode example
%% Plot function
t = 0:0.1:5;
x1 = sin(2*5*t); x2 = cos(3*7*t);...
 Practice: Plot x vs y when y sin(x), y cosx), y sin (2"x), and y-2 sin(x) when x-1:0.1:10. Use 2 by 2 subplot, sin(x) is in location 1, cos(x) is in location 2, sin(2x) is in location 3 and 2 sin(x) is in location 4 The plot should have: (1) x labe|-"х value", y label = 'y value', legend 'y=sin(x)',' y-cos(x)',' y-sin (2*x)', "y-y-2*sin(x), and title = "X Vs. y, under Font Name of Times New Roman, and Font Size...
Most questions answered within 3 hours.
-
A 2180-kg car is slowed down uniformly from 24.6 m/s to 5.2 m/s
in 3.32 s....
asked 3 minutes ago -
Jesse’s Machining is looking to buy a new machine to handle a
new four-year contract for...
asked 9 minutes ago -
5. A slide mount of a fungal specimen is prepared. A slide and
coverslip are flame-sterilized....
asked 12 minutes ago -
A parallel plate capacitor has a charge Q, plates of area A and
separation d, where...
asked 14 minutes ago -
This question goes along with my test results for a psychology
seminar. The results were the...
asked 15 minutes ago -
A calorimeter contains 35.0 mL of water at 13.0 ∘C . When 1.40 g
of X...
asked 20 minutes ago -
[The following information applies to the questions
displayed below.]
Arndt, Inc. reported the following for 2021...
asked 20 minutes ago -
Equivalent Units of Conversion Costs
The Rolling Department of Kraus Steel Company had 2,370 tons in...
asked 27 minutes ago -
Genetic differences between closely related species are due to
changes at both synonymous and nonsynonymous sites...
asked 33 minutes ago -
Assignment:
Implement an 8 bit register in VHDL/Verilog using Model Sim
software. Show two test cases...
asked 37 minutes ago -
Think about the published number of fatalities in the
September 11th disaster in New York. Why...
asked 34 minutes ago -
Suppose you are very allergic to peanuts or even grass, and you
go into anaphylactic shock....
asked 36 minutes ago