In this prelab, all answers should be reported to 3 or 4 significant figures.
Scientific notation format = 2.34E-4. The 'E' must be capitalized."
The prelab questions mirror those that you will be doing at the end of the experiment. Bring your work for this prelab assignment to lab and you will have a much easier time completing the Data Analysis Sheet at the end of the experiment.
When preparing your calibration curve for question 4, use the unrounded numbers from questions 1, 2 and 3. If you use the rounded numbers that you entered in prelab, you may not get the correct slope and intercept.

Homework Answers

Add Answer to:
In this
prelab, all answers should be reported to 3 or 4 significant
figures.
Scientific
notation...
III. Standard Curves When we want to determine the concentration of an unknown solution, we typically measure a certain...
 III. Standard Curves When we want to determine the concentration of an unknown solution, we typically measure a certain property of standard solutions with our standard (known) solutions and create what's called a standard curve (or calibration curve). A standard curve relates two variables of certain known solutions. That way, when there is an unknown variable for a certain solution, it can be determined through the standard curve. When plotting standard curves, we always plot the independent variable on the...
Your ticket will appear here once you na ve correctly ans w ered an or ше реао quesuon. Prelab for Experiment 6-...
 Your ticket will appear here once you na ve correctly ans w ered an or ше реао quesuon. Prelab for Experiment 6- Titration of an Unknown Acid In this prelab, answers to questions l and 2 should be reported toateastisennoantngurs Scientific notation format 2.34E 4. The 'E' must be capitalized." The prelab questions mirror those that you will be doing at the end of the experiment. Bring your work for this prelab assignment to lab and you will have a...
i need help with table 4 question 1-3. i am a little confused on what data...
 i need help with table 4 question 1-3. i am a little confused
on what data to put for the x and y axis. Do i just put the average
density?
B. Density of Liquid (sugar solutions) Table 1: Caleulate the densities of three sugar solutions of known concentrations Sugar solution 1 Sugar solution 2 Sugar solution 3 Concentration (masmass %) of sugar solution Trial Trial 2 Trial Trial 2 Trial 1 Mass of empty graduated cylinder (0 Mass of...
i need help with table 4 question 1-3. i am a little confused
on what data to put for the x and y axis. Do i just put the average
density?
B. Density of Liquid (sugar solutions) Table 1: Caleulate the densities of three sugar solutions of known concentrations Sugar solution 1 Sugar solution 2 Sugar solution 3 Concentration (masmass %) of sugar solution Trial Trial 2 Trial Trial 2 Trial 1 Mass of empty graduated cylinder (0 Mass of...
please show the work Prelab for Experiment 5 - Conductivity and Chemical Reactions 2.34E-4. The 'E' must be capitalized." Scientific notation format The prelab questions mirror tho...
 please show the work
Prelab for Experiment 5 - Conductivity and Chemical Reactions 2.34E-4. The 'E' must be capitalized." Scientific notation format The prelab questions mirror those that you will be doing at the end of the experiment. Bring your work for this prelab assignment to lab and you will have a much easier time completing the Data Analysis Sheet at the end of the experiment. Student information Enter your name (first and last) and the last 4 digits of...
please show the work
Prelab for Experiment 5 - Conductivity and Chemical Reactions 2.34E-4. The 'E' must be capitalized." Scientific notation format The prelab questions mirror those that you will be doing at the end of the experiment. Bring your work for this prelab assignment to lab and you will have a much easier time completing the Data Analysis Sheet at the end of the experiment. Student information Enter your name (first and last) and the last 4 digits of...
please help with question 1 and 3 part c Name: 8 9 Lab Section: 7 Pre-lab: The Concentration of Riboflavin 1. The gi...
 please help with question 1 and 3 part c
Name: 8 9 Lab Section: 7 Pre-lab: The Concentration of Riboflavin 1. The given absorbance spectrum is recorded for a dye. Which is the most likely color of this dye? a. Blue-green b. Colorless c. Red d. Black M stock solution is diluted to 10.00 ml, what is the final 2. IF 4.00 ml of a 5.00 X 10 concentration? 3. The absorbance of known concentrations of blue food dye were...
please help with question 1 and 3 part c
Name: 8 9 Lab Section: 7 Pre-lab: The Concentration of Riboflavin 1. The given absorbance spectrum is recorded for a dye. Which is the most likely color of this dye? a. Blue-green b. Colorless c. Red d. Black M stock solution is diluted to 10.00 ml, what is the final 2. IF 4.00 ml of a 5.00 X 10 concentration? 3. The absorbance of known concentrations of blue food dye were...
Question: Prelab Question #2: A student has weighed out 850 mg of 1-pentanol in 50 mL...
 Question:
Prelab Question #2: A student has weighed out 850 mg of 1-pentanol in 50 mL volumetric flask and prepared four standard solutions as described in this procedure. Calculate concentrations of 1-pentanol in mg/mL in each of these solutions. Instructional Videos to Watch before Lab Fundamentals of GC EXPERIMENTAL PROCEDURE Preparation of Solutions. Get a glassware bin from your TA. Rinse five 10 .00 mL volumetric flasks with 2-propanol (isoproponal) to remove any al cohols remaining in the nprevious usage....
Question:
Prelab Question #2: A student has weighed out 850 mg of 1-pentanol in 50 mL volumetric flask and prepared four standard solutions as described in this procedure. Calculate concentrations of 1-pentanol in mg/mL in each of these solutions. Instructional Videos to Watch before Lab Fundamentals of GC EXPERIMENTAL PROCEDURE Preparation of Solutions. Get a glassware bin from your TA. Rinse five 10 .00 mL volumetric flasks with 2-propanol (isoproponal) to remove any al cohols remaining in the nprevious usage....
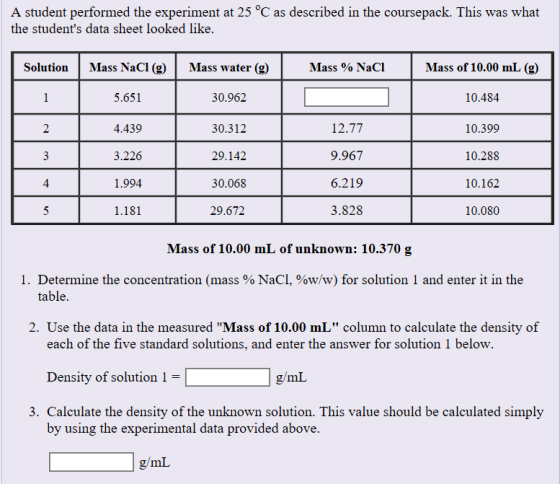
how would i solve for the m/m% of Na+ in the food sample from my calibration...
 how would i solve for the m/m% of Na+ in the food sample from
my calibration curve? ive attatched my other data. thank you in
advance!
5. Area under the curve 1189945 7,00 m/m% of Nat in Food Sample from calibration curve unrounded (show calculation) m/m% of Nat in Food Sample from calibration curve 6.25x10 Quantification of Sodium via Na-23 NMR DOO C2 Part A. Preparation of Standards cel Real Mass Total NaCl(R) Mass (g) FH True % Na Unrounded...
how would i solve for the m/m% of Na+ in the food sample from
my calibration curve? ive attatched my other data. thank you in
advance!
5. Area under the curve 1189945 7,00 m/m% of Nat in Food Sample from calibration curve unrounded (show calculation) m/m% of Nat in Food Sample from calibration curve 6.25x10 Quantification of Sodium via Na-23 NMR DOO C2 Part A. Preparation of Standards cel Real Mass Total NaCl(R) Mass (g) FH True % Na Unrounded...
Question 4 of 4 > Potential (my -21.9 Calibration data for a bromide ion-selective electrode (ISE) was collected...
 Question 4 of 4 > Potential (my -21.9 Calibration data for a bromide ion-selective electrode (ISE) was collected and recorded in the table. The potential of the ISE was measured against a saturated calomel electrode (SCE). All solutions were buffered at a pH of 7.56. A linear calibration curve can be constructed from this data as a plot of potential (in mV) vs. pBr. Determine the slope and y-intercept of such a plot of the calibration data given. [Br"](M) 0.300...
1. Perform the following and express the answer in scientific notation with proper significant figures. 1....
1. Perform the following and express the answer in scientific notation with proper significant figures. 1. 10.6 cm_______________ =____________ m 2. 450,000 ug_______________ =____________ g 3. 12 mL_______________ =____________ cL 4. 50 Mton_______________ =____________ ton 5. 4,600 nm_______________ =____________ um 6. 0.058 kg_______________ =____________ dg 7. 2460 uL_______________ =____________ dL 8. 0.015 s_______________ =____________ ms 9. 0.66 um_______________ =____________ mm 10. 0.062 g_______________ =____________ cg 11. 12,500 cL_______________ =____________ L 12. 61,500 nm_______________ =____________ cm 13. 0.0520 kg_______________ =____________ dag...
DO ALL PARTS OF QUESTION AND USE SIGNIFICANT FIGURES!!!!!!!!! IF YOU DO NOT DO THIS I...
 DO ALL PARTS OF QUESTION AND USE SIGNIFICANT FIGURES!!!!!!!!! IF
YOU DO NOT DO THIS I WILL DOWNVOTE YOU
HERE ARE THE QUESTIONS:
INFORMATION TO USE FOR CALCULATING QUESTIONS:
QUESTION 1 For all of the samples, [Fe3+10 = _M QUESTION 2 For sample 1, [SCN lo = _M. QUESTION 3 For sample 2, [SCN lo = _M For the prelaboratory assignment, you will need to calculate the initial concentrations of [Fe3+10 and [SCN-10 for samples 1-5 that you will use...
DO ALL PARTS OF QUESTION AND USE SIGNIFICANT FIGURES!!!!!!!!! IF
YOU DO NOT DO THIS I WILL DOWNVOTE YOU
HERE ARE THE QUESTIONS:
INFORMATION TO USE FOR CALCULATING QUESTIONS:
QUESTION 1 For all of the samples, [Fe3+10 = _M QUESTION 2 For sample 1, [SCN lo = _M. QUESTION 3 For sample 2, [SCN lo = _M For the prelaboratory assignment, you will need to calculate the initial concentrations of [Fe3+10 and [SCN-10 for samples 1-5 that you will use...
 III. Standard Curves When we want to determine the concentration of an unknown solution, we typically measure a certain property of standard solutions with our standard (known) solutions and create what's called a standard curve (or calibration curve). A standard curve relates two variables of certain known solutions. That way, when there is an unknown variable for a certain solution, it can be determined through the standard curve. When plotting standard curves, we always plot the independent variable on the...
 Your ticket will appear here once you na ve correctly ans w ered an or ше реао quesuon. Prelab for Experiment 6- Titration of an Unknown Acid In this prelab, answers to questions l and 2 should be reported toateastisennoantngurs Scientific notation format 2.34E 4. The 'E' must be capitalized." The prelab questions mirror those that you will be doing at the end of the experiment. Bring your work for this prelab assignment to lab and you will have a...
 i need help with table 4 question 1-3. i am a little confused
on what data to put for the x and y axis. Do i just put the average
density?
B. Density of Liquid (sugar solutions) Table 1: Caleulate the densities of three sugar solutions of known concentrations Sugar solution 1 Sugar solution 2 Sugar solution 3 Concentration (masmass %) of sugar solution Trial Trial 2 Trial Trial 2 Trial 1 Mass of empty graduated cylinder (0 Mass of...
i need help with table 4 question 1-3. i am a little confused
on what data to put for the x and y axis. Do i just put the average
density?
B. Density of Liquid (sugar solutions) Table 1: Caleulate the densities of three sugar solutions of known concentrations Sugar solution 1 Sugar solution 2 Sugar solution 3 Concentration (masmass %) of sugar solution Trial Trial 2 Trial Trial 2 Trial 1 Mass of empty graduated cylinder (0 Mass of...
 please show the work
Prelab for Experiment 5 - Conductivity and Chemical Reactions 2.34E-4. The 'E' must be capitalized." Scientific notation format The prelab questions mirror those that you will be doing at the end of the experiment. Bring your work for this prelab assignment to lab and you will have a much easier time completing the Data Analysis Sheet at the end of the experiment. Student information Enter your name (first and last) and the last 4 digits of...
please show the work
Prelab for Experiment 5 - Conductivity and Chemical Reactions 2.34E-4. The 'E' must be capitalized." Scientific notation format The prelab questions mirror those that you will be doing at the end of the experiment. Bring your work for this prelab assignment to lab and you will have a much easier time completing the Data Analysis Sheet at the end of the experiment. Student information Enter your name (first and last) and the last 4 digits of...
 please help with question 1 and 3 part c
Name: 8 9 Lab Section: 7 Pre-lab: The Concentration of Riboflavin 1. The given absorbance spectrum is recorded for a dye. Which is the most likely color of this dye? a. Blue-green b. Colorless c. Red d. Black M stock solution is diluted to 10.00 ml, what is the final 2. IF 4.00 ml of a 5.00 X 10 concentration? 3. The absorbance of known concentrations of blue food dye were...
please help with question 1 and 3 part c
Name: 8 9 Lab Section: 7 Pre-lab: The Concentration of Riboflavin 1. The given absorbance spectrum is recorded for a dye. Which is the most likely color of this dye? a. Blue-green b. Colorless c. Red d. Black M stock solution is diluted to 10.00 ml, what is the final 2. IF 4.00 ml of a 5.00 X 10 concentration? 3. The absorbance of known concentrations of blue food dye were...
 Question:
Prelab Question #2: A student has weighed out 850 mg of 1-pentanol in 50 mL volumetric flask and prepared four standard solutions as described in this procedure. Calculate concentrations of 1-pentanol in mg/mL in each of these solutions. Instructional Videos to Watch before Lab Fundamentals of GC EXPERIMENTAL PROCEDURE Preparation of Solutions. Get a glassware bin from your TA. Rinse five 10 .00 mL volumetric flasks with 2-propanol (isoproponal) to remove any al cohols remaining in the nprevious usage....
Question:
Prelab Question #2: A student has weighed out 850 mg of 1-pentanol in 50 mL volumetric flask and prepared four standard solutions as described in this procedure. Calculate concentrations of 1-pentanol in mg/mL in each of these solutions. Instructional Videos to Watch before Lab Fundamentals of GC EXPERIMENTAL PROCEDURE Preparation of Solutions. Get a glassware bin from your TA. Rinse five 10 .00 mL volumetric flasks with 2-propanol (isoproponal) to remove any al cohols remaining in the nprevious usage....
 how would i solve for the m/m% of Na+ in the food sample from
my calibration curve? ive attatched my other data. thank you in
advance!
5. Area under the curve 1189945 7,00 m/m% of Nat in Food Sample from calibration curve unrounded (show calculation) m/m% of Nat in Food Sample from calibration curve 6.25x10 Quantification of Sodium via Na-23 NMR DOO C2 Part A. Preparation of Standards cel Real Mass Total NaCl(R) Mass (g) FH True % Na Unrounded...
how would i solve for the m/m% of Na+ in the food sample from
my calibration curve? ive attatched my other data. thank you in
advance!
5. Area under the curve 1189945 7,00 m/m% of Nat in Food Sample from calibration curve unrounded (show calculation) m/m% of Nat in Food Sample from calibration curve 6.25x10 Quantification of Sodium via Na-23 NMR DOO C2 Part A. Preparation of Standards cel Real Mass Total NaCl(R) Mass (g) FH True % Na Unrounded...
 Question 4 of 4 > Potential (my -21.9 Calibration data for a bromide ion-selective electrode (ISE) was collected and recorded in the table. The potential of the ISE was measured against a saturated calomel electrode (SCE). All solutions were buffered at a pH of 7.56. A linear calibration curve can be constructed from this data as a plot of potential (in mV) vs. pBr. Determine the slope and y-intercept of such a plot of the calibration data given. [Br"](M) 0.300...
 DO ALL PARTS OF QUESTION AND USE SIGNIFICANT FIGURES!!!!!!!!! IF
YOU DO NOT DO THIS I WILL DOWNVOTE YOU
HERE ARE THE QUESTIONS:
INFORMATION TO USE FOR CALCULATING QUESTIONS:
QUESTION 1 For all of the samples, [Fe3+10 = _M QUESTION 2 For sample 1, [SCN lo = _M. QUESTION 3 For sample 2, [SCN lo = _M For the prelaboratory assignment, you will need to calculate the initial concentrations of [Fe3+10 and [SCN-10 for samples 1-5 that you will use...
DO ALL PARTS OF QUESTION AND USE SIGNIFICANT FIGURES!!!!!!!!! IF
YOU DO NOT DO THIS I WILL DOWNVOTE YOU
HERE ARE THE QUESTIONS:
INFORMATION TO USE FOR CALCULATING QUESTIONS:
QUESTION 1 For all of the samples, [Fe3+10 = _M QUESTION 2 For sample 1, [SCN lo = _M. QUESTION 3 For sample 2, [SCN lo = _M For the prelaboratory assignment, you will need to calculate the initial concentrations of [Fe3+10 and [SCN-10 for samples 1-5 that you will use...
Most questions answered within 3 hours.
-
A 8.15- g bullet from a 9-mm pistol has a velocity of 366.0 m/s.
It strikes...
asked 1 hour ago -
The outstanding bonds of Alpha Extracts have a yield to maturity
of 7.4 percent and a...
asked 1 hour ago -
The Problem: The Case of the Harmonizing Vacations
Your CEO is exploring partnering with a European...
asked 2 hours ago -
A chemical equation is balanced by adding coefficients in front
of some formulas so that the...
asked 2 hours ago -
From the literature (reference your sources): What are the
lattice parameters of calcite and aragonite? Why...
asked 3 hours ago -
Your system is rejecting the question am asking which is
preceded by a case study. It...
asked 3 hours ago -
3. On January 2, 2000, Larry creates a trust with himself as
trustee. Larry as trustee...
asked 3 hours ago -
A member of the volleyball team spikes the ball. During this
process, she changes the velocity...
asked 3 hours ago -
Are adult gamers less likely to use a gaming console (Xbox,
PlayStation, Wii, etc...) than teen...
asked 4 hours ago -
The University of
Texas recently reported that 43% of college students aged 18-24
would spend their...
asked 4 hours ago -
The length of stay at a specific emergency department in
Phoenix, Arizona, in 2009 had a...
asked 3 hours ago -
. Please give the mechanism for this type of problem. Step by
Step
The toxin that...
asked 3 hours ago