
Homework Answers

Add Answer to:
2. (20 points) Test if a person's political affiliation and their opinion on a tax reform...
affiliation and opinion on a tax reform bill. Te ress of this survey are su contingency...
 affiliation and opinion on a tax reform bill. Te ress of this survey are su contingency table, Round all answers to four decimal places A random sample of 500 U.S. aduits is questioned re regarding their political total democrat republican total favor 138 64 202 indifferent 83 67 opposed 64 84 148 285 500 (4)Problem 7A: Se managers-claim -that equal -amon t up the hypótheses for a chi square fest of independence to test the for albs-were-on-hend-at the 55 level...
A random sample of 496 U.S. adults are questioned regarding their political affiliation and opinion on...
 A random sample of 496 U.S. adults are questioned regarding their political affiliation and opinion on a tax reform bill. The two categorical variables are political yffiliation and opinion on the tax reform bill. The observed contingency table is given below. Favor Indiferent Opposed Tota 82 63 150 Republican 6 83 146 496 14 Tota200 A) This sample has degree of freedom: DE If political affiliation and opinion on the tax retum bill are independent, then B) Accurate to 2...
Question 9 S points Save Answer A survey of 285 Democrats and 215 Republicans were asked...
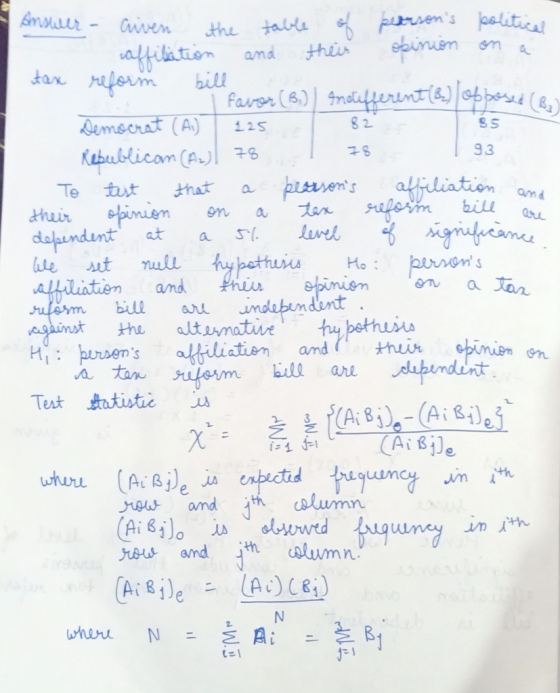
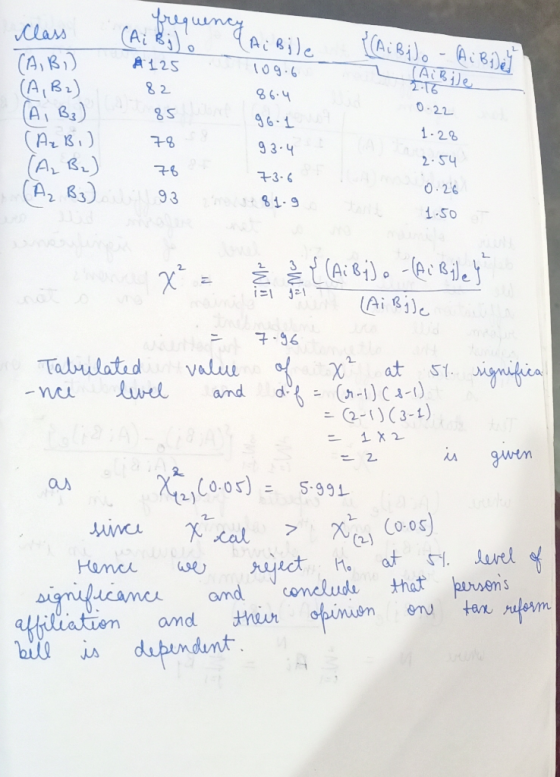
 Question 9 S points Save Answer A survey of 285 Democrats and 215 Republicans were asked their opinion on tax reform. The results of the survey are shown in the table below. What conclusion can be drawn from a chi-square test for independence at the OS level? Favor Indifferent Opposed 64 Total 285 Democrat 138 83 84 67 215 Republican 150 148 500 Total 202 Reject the null hypothesis and conclude, at 0.05, that party affiliation and opinion on tax...
Party Affiliation and Opinion on Tax Reform example. 83 favor indifferent opposed total democrat 138 64...
 Party Affiliation and Opinion on Tax Reform example. 83 favor indifferent opposed total democrat 138 64 285 republican 64 67 84 215 total 202 150 148 500 Here are the formulae. Given that chi square = a (f. – fo)? /fe , and that fe= (row marginal*column marginal)/sample size, and that df = (# rows - 1) * (# columns - 1) a) How many "degrees of freedom" are associated with this table? b) State the null hypothesis for this...
NEED QUICK will thumbs up! A political researcher wishes to know if political affiliation and age...
NEED QUICK will thumbs up! A political researcher wishes to know if political affiliation and age are related. He has collected data on 409 persons in three age categories. Is there evidence that age and political affiliation are related? Age Democrat Republican Independent Total 18-31 61 57 34 152 32-51 59 63 29 151 52-68 40 43 23 106 Total 160 163 86 409 Step 1: State the null and alternative hypothesis. H0H0: political affiliation and age are dependent HaHa:...
Support of Background Checks by Political Party: In April of 2013, the U.S. Senate did not...
Support of Background Checks by Political Party: In April of 2013, the U.S. Senate did not pass a bill to expand background checks to all gun sales despite popular approval of the idea. Gallup conducted a poll on this issue with the question: Would you vote for or against a law to require background checks for all gun sales?. The results by political affiliation are summarized in the contingency table below. Observed Frequencies: Oi's Republican Independent Democrat Totals For Checks...
In order to receive credit for the homework, you must show all steps for doing a chi square test of independence. T...
 In order to receive credit for the homework, you must show all steps for doing a chi square test of independence. These steps include: null and alternative hypothesis); critical value; calculations (show work); reject or accept H; results statement using no relationship or a relationship. A random sample of 500 voters were selected and asked their opinion on tax reform. The sample was further divided into Democrats and Republicans. The following table gives the results of the poll. At a...
6) The contingency table below shows the results of a random sample of 200 registered voters...
6) The contingency table below shows the results of a random sample of 200 registered voters that was conducted to see whether their opinions on a bill are related to their party affiliation. Level of significance: α = 0.05 Party Opinion Approve Disapprove No Opinion Republican 42 20 14 Democrat 50 24 18 Independent 10 16 6 Find the P-value to test the claim of independence. STEP 1: Hypothesis Ho: ___________________________________ vs H1: ___________________________________ STEP 2: Restate the level of...
1. (-/10 Points] DETAILS 0/2 Submissions Used MY NOTES PRACTICE ANOTHER A polling firm randomly surveys...
 1. (-/10 Points] DETAILS 0/2 Submissions Used MY NOTES PRACTICE ANOTHER A polling firm randomly surveys 230 registered voters across the United States. Two of the survey questions ask respondents to state their gender (male or female) and their political affiliation (democrat, republican, independent, or other). The results of this survey are shown in the table below. Democrat Republican Independent Other Totals Female 66 43 20 5 134 Male 36 21 33 6 96 Totals 102 64 53 11 230...
A political poll asked potential voters if they felt the economy was going to get worse,...
 A political poll asked potential voters if they felt the economy was going to get worse, or better during the next 12 months. The party affiliations of the respondents were also noted. The results are shown in the following table. To test at the 0.1 level to determine if Party Affiliation and Response are dependent, calculate the chi- square test statistic and p-value. Cross Tabulation of Party Affiliation vs. Response Worse Better 43 16 Republican 16 60 Democrat 1) None...
 affiliation and opinion on a tax reform bill. Te ress of this survey are su contingency table, Round all answers to four decimal places A random sample of 500 U.S. aduits is questioned re regarding their political total democrat republican total favor 138 64 202 indifferent 83 67 opposed 64 84 148 285 500 (4)Problem 7A: Se managers-claim -that equal -amon t up the hypótheses for a chi square fest of independence to test the for albs-were-on-hend-at the 55 level...
 A random sample of 496 U.S. adults are questioned regarding their political affiliation and opinion on a tax reform bill. The two categorical variables are political yffiliation and opinion on the tax reform bill. The observed contingency table is given below. Favor Indiferent Opposed Tota 82 63 150 Republican 6 83 146 496 14 Tota200 A) This sample has degree of freedom: DE If political affiliation and opinion on the tax retum bill are independent, then B) Accurate to 2...
 Question 9 S points Save Answer A survey of 285 Democrats and 215 Republicans were asked their opinion on tax reform. The results of the survey are shown in the table below. What conclusion can be drawn from a chi-square test for independence at the OS level? Favor Indifferent Opposed 64 Total 285 Democrat 138 83 84 67 215 Republican 150 148 500 Total 202 Reject the null hypothesis and conclude, at 0.05, that party affiliation and opinion on tax...
 Party Affiliation and Opinion on Tax Reform example. 83 favor indifferent opposed total democrat 138 64 285 republican 64 67 84 215 total 202 150 148 500 Here are the formulae. Given that chi square = a (f. – fo)? /fe , and that fe= (row marginal*column marginal)/sample size, and that df = (# rows - 1) * (# columns - 1) a) How many "degrees of freedom" are associated with this table? b) State the null hypothesis for this...
 In order to receive credit for the homework, you must show all steps for doing a chi square test of independence. These steps include: null and alternative hypothesis); critical value; calculations (show work); reject or accept H; results statement using no relationship or a relationship. A random sample of 500 voters were selected and asked their opinion on tax reform. The sample was further divided into Democrats and Republicans. The following table gives the results of the poll. At a...
 1. (-/10 Points] DETAILS 0/2 Submissions Used MY NOTES PRACTICE ANOTHER A polling firm randomly surveys 230 registered voters across the United States. Two of the survey questions ask respondents to state their gender (male or female) and their political affiliation (democrat, republican, independent, or other). The results of this survey are shown in the table below. Democrat Republican Independent Other Totals Female 66 43 20 5 134 Male 36 21 33 6 96 Totals 102 64 53 11 230...
 A political poll asked potential voters if they felt the economy was going to get worse, or better during the next 12 months. The party affiliations of the respondents were also noted. The results are shown in the following table. To test at the 0.1 level to determine if Party Affiliation and Response are dependent, calculate the chi- square test statistic and p-value. Cross Tabulation of Party Affiliation vs. Response Worse Better 43 16 Republican 16 60 Democrat 1) None...
Most questions answered within 3 hours.
-
Why do organizations decline? What steps can top
management take to halt, decline, and restore organizational...
asked 6 minutes ago -
Under the influence of its drive force, a snowmobile is moving
at a constant velocity along...
asked 20 minutes ago -
What mechanisms Drive speciation??
(I.e. what was Dawins theory on the orgin of species, and how...
asked 1 hour ago -
The manager at a car assembly plant believes that the mean
assembly time for a car...
asked 2 hours ago -
Which of the following is true of electron capture?
A) It decreases the nuclide's mass number...
asked 4 hours ago -
Assuming an efficiency of 43.10%, calculate the actual yield of
magnesium nitrate formed from 114.9 g...
asked 4 hours ago -
The highly pathogenic bacterium Clostridium
perfringens causes gangrene, a disease that results in the
destruction of...
asked 6 hours ago -
In the context of situation analysis, which of the following is
a category for analysis in...
asked 6 hours ago -
In a study of the gas phase decomposition of sulfuryl chloride
at 600 K SO2Cl2(g)SO2(g) +...
asked 6 hours ago -
75 g of 2-propanol (C3H8O) and 25 g of pentane are mixed in a
200 mL...
asked 6 hours ago -
The 2800-turn coil in a dc motor has an area per turn of 1.1 ×
10-2...
asked 6 hours ago -
Draw a combinational logic circuit diagram with a symbol inside
the box for two I/P of...
asked 6 hours ago