HELP!! Need to know how to do the graphs for these. And can you please explain it to me so I can learn it?
Homework Answers

Add Answer to:
HELP!! Need to know how to do the graphs for these. And can you
please explain...
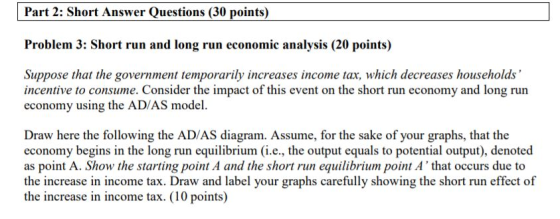
Don't need answer to 1 and 2. NEED solution for rest of questions please. Suppose the...
 Don't need answer to 1 and 2. NEED solution for rest of
questions please.
Suppose the economy is starting from a situation of long-run equilibrium. In this case, we know that its equilibrium output (Y) is equal to greater than less than its potential output (Y'). Starting from its long-run equilibrium at point 1 in the figure to the right, suppose the economy experiences a positive demand shock. 1) Using the line drawing tool, shift a single curve to show...
Don't need answer to 1 and 2. NEED solution for rest of
questions please.
Suppose the economy is starting from a situation of long-run equilibrium. In this case, we know that its equilibrium output (Y) is equal to greater than less than its potential output (Y'). Starting from its long-run equilibrium at point 1 in the figure to the right, suppose the economy experiences a positive demand shock. 1) Using the line drawing tool, shift a single curve to show...
Monetary Policy: Keynesian model a. Draw graphs for the IS-LM-FE model, the AD-AS model, and labor...
Monetary Policy: Keynesian model a. Draw graphs for the IS-LM-FE model, the AD-AS model, and labor market equilibrium for the Keynesian model with efficiency wages for an economy in a long-run equilibrium. Label equilibrium points.
4. Again refer to Figure 1, starting from point ", and assume the initial long-run equilibrium...
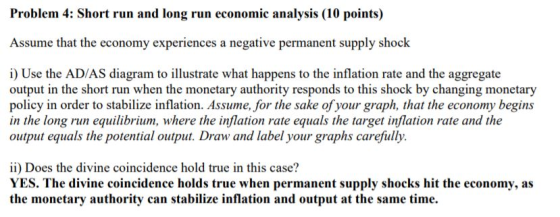
 4. Again refer to Figure 1, starting from point ", and assume the initial long-run equilibrium inflation rate is also the Fed's targeted inflation rate. (a) This cconomy sutfers a shock, and the inflation rate increases while real output falls. Most likely, this is a shock (indicate whether this isa positive (+) or a nagative (-)shock, causing thecurve toC Call the temporary equilibrium as "2" (b) The Central Bank decides to stabilize real output at the potential output level. It...
supply curve to shift leftward to SRAS, as shown in the graph at right. The economy is currently in short-run equilibrium at point E, and the reduction in supply is expected to be permanent. LRAS...
 supply curve to shift leftward to SRAS, as shown in the graph at right. The economy is currently in short-run equilibrium at point E, and the reduction in supply is expected to be permanent. LRAS SRAS SRAS 1.) Using the line drawing and/or 3-point curved line drawing tool, show the adjustment to long-run equilibrium in this situation. Properly label your new curve(s). 2.) Using the point drawing tool, identify the new long-run equilibrium point and label the point 'E2 Carefully...
The following graphs show the state of an economy that is currently in long-run equilibrium.
 3. The long-run effects of monetary policy The following graphs show the state of an economy that is currently in long-run equilibrium. The first graph shows the aggregate demand (AD) and long-run aggregate supply (LRAS) curves. The second shows the long-run and short-run Phillips curves (LRPC and SRPC).Which of the following statements are true based on these graphs? Check all that apply The natural level of output is $3 trillion. The unemployment rate is currently 6% higher than the natural rate of unemployment. The...
QUESTION 7 (25 points): Economic Fluctuation using AD-AS framework Suppose that the short-run aggregate supply curve...
 QUESTION 7 (25 points): Economic Fluctuation using AD-AS framework Suppose that the short-run aggregate supply curve has a positive slope and that the economy starts at a long-run equilibrium. Now imagine that 10 million people move to Australia they found that Australians live an average of 10 extra years due to the relax lifestyle that they enjoy. This is a permanent change in Labor in the U.S. economy. (a) (10 points) No Policy Intervention: Using the model of Aggregate Demand...
please answer only if you can complete the entire question. Question 4 (25 points) - Chapter...
 please answer only if you can complete the entire question.
Question 4 (25 points) - Chapter 10, 11 & 12 Suppose a destructive wave of wildfires sweeps through the country of Tinderbox, which for the simplicity of our economic modeling is assumed to be a closed economy. Unfortunately, the fire causes the death of many of the country's wild animals, but fortunately no humans die and no buildings or equipment is damaged by the fires. The widespread destruction causes both...
please answer only if you can complete the entire question.
Question 4 (25 points) - Chapter 10, 11 & 12 Suppose a destructive wave of wildfires sweeps through the country of Tinderbox, which for the simplicity of our economic modeling is assumed to be a closed economy. Unfortunately, the fire causes the death of many of the country's wild animals, but fortunately no humans die and no buildings or equipment is damaged by the fires. The widespread destruction causes both...
LRAS In the graph to the right illustrating the AD-AS model, assume the economy was in...
 LRAS In the graph to the right illustrating the AD-AS model, assume the economy was in equilibrium at point E1. Then, assume there was a decline in spending on new houses. Where does short-run equilibrium occur? Where does long-run equilibrium occur? 1.) Using the point drawing tool, plot the point that represents short-run equilibrium. Label this point E2. Price level, P. SRAS a SRAS2E1 2.) Using the point drawing tool, plot the point that represents long-run equilibrium. Label this point...
6. The long-run effects of monetary policy Aa Aa The following graphs show an economy that is cur...
 6. The long-run effects of monetary policy The following graphs show an economy that is currently in long-run equilibrium. The first graph shows the aggregate demand (AD) and long-run aggregate supply (LRAS) curves. The second shows the long-run (LR) and short-run (SR) Phillips curves. The point on each graph shows the economy's current position. According to the graphs, potential output in this economy is _______ and the natural rate of unemployment is _______ .Suppose the central bank of the economy decreases the...
draw a graph Suppose that a closed economy with zero inflation is hit by a negative...
 draw a graph
Suppose that a closed economy with zero inflation is hit by a negative shock to autonomous consumption. The government is considering (a) using fiscal policy (b) using monetary policy (c) letting the economy self-equilibrate. a. Draw graphs showing the goods market and money market in long run equilibrium before the negative AD shock. Be careful to show how the levels of the variables in each market are related.
draw a graph
Suppose that a closed economy with zero inflation is hit by a negative shock to autonomous consumption. The government is considering (a) using fiscal policy (b) using monetary policy (c) letting the economy self-equilibrate. a. Draw graphs showing the goods market and money market in long run equilibrium before the negative AD shock. Be careful to show how the levels of the variables in each market are related.
 Don't need answer to 1 and 2. NEED solution for rest of
questions please.
Suppose the economy is starting from a situation of long-run equilibrium. In this case, we know that its equilibrium output (Y) is equal to greater than less than its potential output (Y'). Starting from its long-run equilibrium at point 1 in the figure to the right, suppose the economy experiences a positive demand shock. 1) Using the line drawing tool, shift a single curve to show...
Don't need answer to 1 and 2. NEED solution for rest of
questions please.
Suppose the economy is starting from a situation of long-run equilibrium. In this case, we know that its equilibrium output (Y) is equal to greater than less than its potential output (Y'). Starting from its long-run equilibrium at point 1 in the figure to the right, suppose the economy experiences a positive demand shock. 1) Using the line drawing tool, shift a single curve to show...
 4. Again refer to Figure 1, starting from point ", and assume the initial long-run equilibrium inflation rate is also the Fed's targeted inflation rate. (a) This cconomy sutfers a shock, and the inflation rate increases while real output falls. Most likely, this is a shock (indicate whether this isa positive (+) or a nagative (-)shock, causing thecurve toC Call the temporary equilibrium as "2" (b) The Central Bank decides to stabilize real output at the potential output level. It...
 supply curve to shift leftward to SRAS, as shown in the graph at right. The economy is currently in short-run equilibrium at point E, and the reduction in supply is expected to be permanent. LRAS SRAS SRAS 1.) Using the line drawing and/or 3-point curved line drawing tool, show the adjustment to long-run equilibrium in this situation. Properly label your new curve(s). 2.) Using the point drawing tool, identify the new long-run equilibrium point and label the point 'E2 Carefully...
 QUESTION 7 (25 points): Economic Fluctuation using AD-AS framework Suppose that the short-run aggregate supply curve has a positive slope and that the economy starts at a long-run equilibrium. Now imagine that 10 million people move to Australia they found that Australians live an average of 10 extra years due to the relax lifestyle that they enjoy. This is a permanent change in Labor in the U.S. economy. (a) (10 points) No Policy Intervention: Using the model of Aggregate Demand...
 please answer only if you can complete the entire question.
Question 4 (25 points) - Chapter 10, 11 & 12 Suppose a destructive wave of wildfires sweeps through the country of Tinderbox, which for the simplicity of our economic modeling is assumed to be a closed economy. Unfortunately, the fire causes the death of many of the country's wild animals, but fortunately no humans die and no buildings or equipment is damaged by the fires. The widespread destruction causes both...
please answer only if you can complete the entire question.
Question 4 (25 points) - Chapter 10, 11 & 12 Suppose a destructive wave of wildfires sweeps through the country of Tinderbox, which for the simplicity of our economic modeling is assumed to be a closed economy. Unfortunately, the fire causes the death of many of the country's wild animals, but fortunately no humans die and no buildings or equipment is damaged by the fires. The widespread destruction causes both...
 LRAS In the graph to the right illustrating the AD-AS model, assume the economy was in equilibrium at point E1. Then, assume there was a decline in spending on new houses. Where does short-run equilibrium occur? Where does long-run equilibrium occur? 1.) Using the point drawing tool, plot the point that represents short-run equilibrium. Label this point E2. Price level, P. SRAS a SRAS2E1 2.) Using the point drawing tool, plot the point that represents long-run equilibrium. Label this point...
 draw a graph
Suppose that a closed economy with zero inflation is hit by a negative shock to autonomous consumption. The government is considering (a) using fiscal policy (b) using monetary policy (c) letting the economy self-equilibrate. a. Draw graphs showing the goods market and money market in long run equilibrium before the negative AD shock. Be careful to show how the levels of the variables in each market are related.
draw a graph
Suppose that a closed economy with zero inflation is hit by a negative shock to autonomous consumption. The government is considering (a) using fiscal policy (b) using monetary policy (c) letting the economy self-equilibrate. a. Draw graphs showing the goods market and money market in long run equilibrium before the negative AD shock. Be careful to show how the levels of the variables in each market are related.
Most questions answered within 3 hours.
-
Write a program to prompt the user for hours and rate per hour
using input to...
asked 12 minutes ago -
Hi, please help
1)Draw two molecules that could hydrogen bond with each other.
Draw and indicate...
asked 16 minutes ago -
Using Java, I created 3 files, Pizza,PizzaOrder, and
PizzaOrder_Demo that I attached down below. But I...
asked 15 minutes ago -
a. An 8-bit successive approximation ADC has a reference voltage
of 10 V. Calculate the resolution...
asked 25 minutes ago -
The distance between the two hydrogen nuclei in the H2 molecule
is 110 pm (picometer). How...
asked 27 minutes ago -
write an article about drone effect on
construction safety.
asked 30 minutes ago -
Consider the following data for a dependent variable y and two
independent variables, x1 and x2....
asked 1 hour ago -
what is the most likely shape for a distribution with a mean of
40 and a...
asked 41 minutes ago -
The work function, Φ0 (or W0), for cesium is 3.43×10⁻¹⁹ J. The
frequency of a photon...
asked 47 minutes ago -
18.54----At the surface of Venus the average temperature is a
balmy 460 ∘C due to the...
asked 46 minutes ago -
#1. A food has been ingested. Identify all of the anatomic
structures and substructures it travels...
asked 39 minutes ago -
Grommit Engineering expects to have net income next year of $
29.71 million and free cash...
asked 48 minutes ago