Discuss why adoption of IFRS 1 was met with controversy and how Luxottica Group, a 2010 first-time adopter, presented its statement of financial position and what alternatives were available.
Homework Answers
Controvertial adoption of IFRS 1 :
Conversion from U.S. GAAP to IFRS is a profoundly debated topic in the corporate world. Probable benefits of adoption comprise reporting consistency, heightened global competition and upgraded financial reporting transparency. While many countries worldwide have already accepted IFRS, many other countries are thoroughly investigative its effects before adoption, not only from an economic perspective but also from a reporting quality position.
The researchers studied the difference in reporting among the two and found that the calculated difference between shareholders’ equity under U.S. GAAP and under IFRS declined over a period of time. In addition, the difference between U.S. GAAP and IFRS reported net income during the period under consideration also declined but remained significantly different. Pensions and goodwill appeared to be the dominant reconciliation items.
Comments on the presentation made by Luxottica Group :
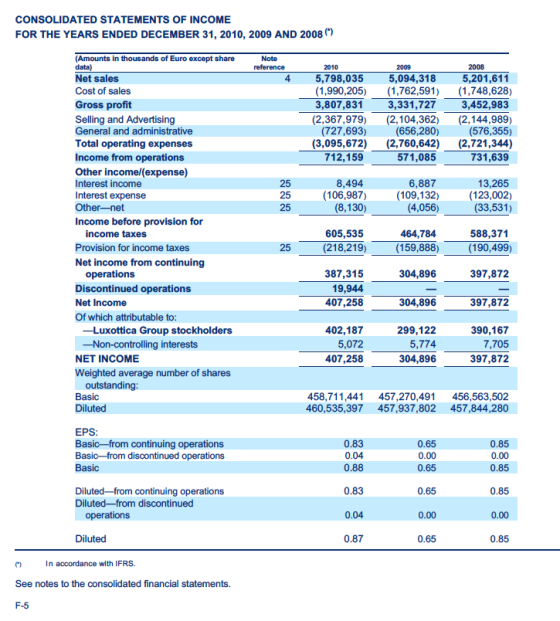
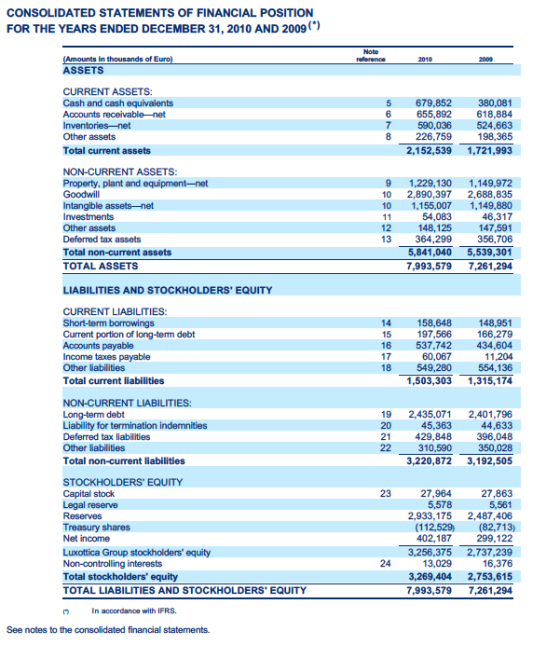
- Luxottica Group has presented its Statement of Profit and Loss and Statement of Affairs for three reporting year i.e. the opening balances on the transition date, the closing balance on the transition date and the closing balances for the reporting period.
- Luxottica Group has not included Other Comprehensive income as part of the Statement of Profit and Loss, which is a must as per the provision of IFRS.
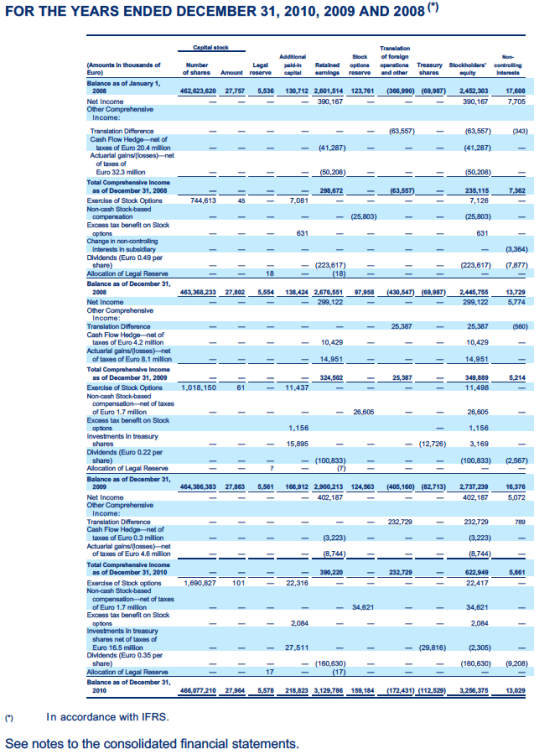
- Luxottica Group has presented a statement of changes in Equity, which is correct as per the provisions of IFRS
- Luxottica Group has not incorporated the concept of Financial Assets and Financial Liabilities in the Statement of Financial Position. While these are a must to incorporate under both heads i.e. Current and Non Current, which depicts the figures of close to liquid assets and liabilities as per the defiinition prescribed under IFRS 9.
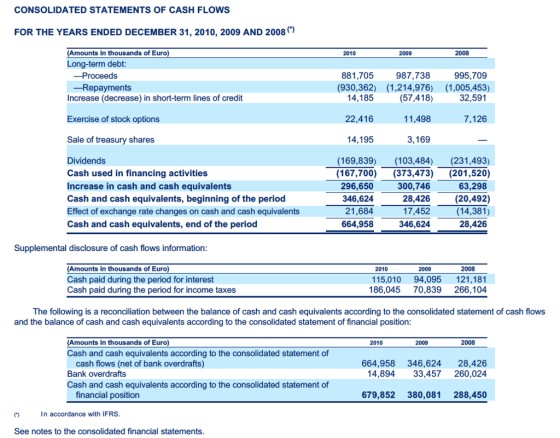
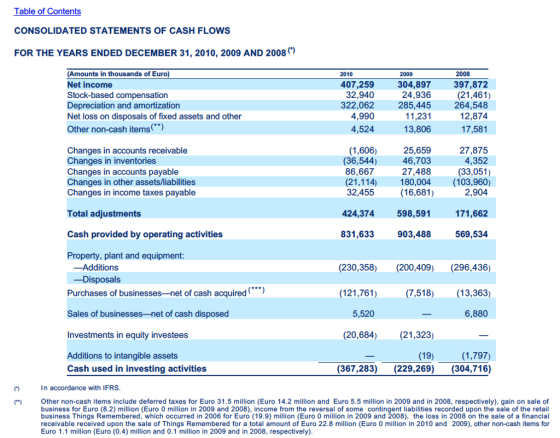
- Cash flow statement looks decent as per the requirements of IAS 7.
That was all about the major presentation requirements to be followed by Luxottica Group. Hope you find it useful. ;-)
Add Answer to:
Discuss why adoption of IFRS 1 was met with controversy and how
Luxottica Group, a 2010...
Can you explain why cash and equity change when the company switches from LIFO to FIFO, and why there is no change or up...
 Can you explain why cash and equity change
when the company switches from LIFO to FIFO, and why there is no
change or up by 121.2 in net income and why does it different from
the net income from Q3?
3. What would DuPont's net income for 2015 have been if it had been using FIFO to account for all of its inventories? In answering this question, please assume a 40% tax rate. Please use the net income attributable to...
Can you explain why cash and equity change
when the company switches from LIFO to FIFO, and why there is no
change or up by 121.2 in net income and why does it different from
the net income from Q3?
3. What would DuPont's net income for 2015 have been if it had been using FIFO to account for all of its inventories? In answering this question, please assume a 40% tax rate. Please use the net income attributable to...
Compute P&G's gross profit for each of the years 2015-2017. Explain why gross profit decreased in...
 Compute P&G's gross profit for each of the years 2015-2017.
Explain why gross profit decreased in 2017.
What are P&G's primary revenue sources
B-2 APPENDIX B Specimen Financial Statements: The Procter & Gamble Company 2017 $ 65,058 32,535 18,568 2016 2015 $ 65,299 $ 70,749 32,909 37,056 18,949 20,616 2,028 11,049 1395 Consolidated Statements of Earnings Amounts in millions except per share amounts: Years ended June 30 NET SALES Cost of products sold Selling, general and administrative expense Venezuela deconsolidation...
Compute P&G's gross profit for each of the years 2015-2017.
Explain why gross profit decreased in 2017.
What are P&G's primary revenue sources
B-2 APPENDIX B Specimen Financial Statements: The Procter & Gamble Company 2017 $ 65,058 32,535 18,568 2016 2015 $ 65,299 $ 70,749 32,909 37,056 18,949 20,616 2,028 11,049 1395 Consolidated Statements of Earnings Amounts in millions except per share amounts: Years ended June 30 NET SALES Cost of products sold Selling, general and administrative expense Venezuela deconsolidation...
Estimating Cost of Debt Capital Assume the December 31, 2010, partial financial statements taken from the...
Estimating Cost of Debt Capital Assume the December 31, 2010, partial financial statements taken from the annual report for AT&T (T) follow. Consolidated Statements of Income Dollars in millions 2010 Operating revenues Wireless service $ 53,510 Voice 28,315 Data 27,479 Directory 3,935 Other 11,041 Total operating revenues 124,280 Operating expenses Cost of services and sales 52,263 Selling, general and administrative 33,065 Depreciation and amortization 19,379 Total operating expenses 104,707 Operating income 19,573 Other income (expense) Interest expense (3,094) Equity in...
Estimating Cost of Debt Capital Assume the December 31, 2010, partial financial statements taken from the...
Estimating Cost of Debt Capital Assume the December 31, 2010, partial financial statements taken from the annual report for AT&T (T) follow. Consolidated Statements of Income Dollars in millions 2010 Operating revenues Wireless service $ 53,510 Voice 28,315 Data 27,479 Directory 3,935 Other 11,041 Total operating revenues 124,280 Operating expenses Cost of services and sales 52,263 Selling, general and administrative 33,065 Depreciation and amortization 19,379 Total operating expenses 104,707 Operating income 19,573 Other income (expense) Interest expense (3,394) Equity in...
AR inancial Statements: Wal-Mart Stores, Inc. ores, Inc.'s financial statements as presented in the company's 2016...
 AR inancial Statements: Wal-Mart Stores, Inc. ores, Inc.'s financial statements as presented in the company's 2016 annual report. The complete annual report, including notes to site. Consolidated Statements of Income Facal than inded onuary at 2016 2015 2014 Revenues Neties Membership and other income Total revenues Costs and expenses 547 614 3,516 82110 70 3.218 06.294 5651 Operating ng general and administrave expenses Operating income 10084 97,041 24,105 93418 27.147 97253 26,82 2027 2161 Capital lease and financing obligations 2,467...
Compare income statment and balance sheet for the last two years any changes? analyize cash flow ...
 compare income statment and balance sheet for the last two
years
any changes?
analyize cash flow
operating activities
investing activities
financing activities
of Financial Position Statements February 3, Janua millions, except footnotes) $ 2,643 $ 2,512 8,309 1.169 11,990 8,657 1,264 12,564 equivalents Cash and cash Other current assets Total current assets Property and equipment 6,095 28,396 5,623 2,645 6,106 27,611 5,503 2,651 Buildings and improvements Fixtures and equipment Computer hardware and software 440 200 Construction-in-progress Accumulated depreciation (18,181) (17,413)...
compare income statment and balance sheet for the last two
years
any changes?
analyize cash flow
operating activities
investing activities
financing activities
of Financial Position Statements February 3, Janua millions, except footnotes) $ 2,643 $ 2,512 8,309 1.169 11,990 8,657 1,264 12,564 equivalents Cash and cash Other current assets Total current assets Property and equipment 6,095 28,396 5,623 2,645 6,106 27,611 5,503 2,651 Buildings and improvements Fixtures and equipment Computer hardware and software 440 200 Construction-in-progress Accumulated depreciation (18,181) (17,413)...
Compute Cost of Sales,Selling, General and Admin Expenses and taxes as a percent of revenue...
1) Compute Cost of Sales,Selling, General and Admin Expenses and taxes as a percent of revenue for 2012,2011 and explain how Google net income has changed over the three year period2) Compute current and non current assets as a percent of total assets and explain how google asset structure changed from 2011 to 20123) Compute current and long term liabilities as a percent of total assets and explain how google reliance on liabilites as a source of financing changed from...
Calculate the altman Z-score that is the question 12. Calculate the market-to-book ratio of the company...
 Calculate the altman Z-score that is the question
12. Calculate the market-to-book ratio of the company as of Feb 2, 2019. This is the Feb 2, 2019 market capitalization of the stock divided by the latest book value of shareholders' equity. Target's stock closed at $68.97 per share on the last trading day of the fiscal year, which was Feb 1, 2019. Shane price X share 2. Bankruptcy Risk. Calculate the Altman Z-Score as of the 2018 balance sheet date....
Calculate the altman Z-score that is the question
12. Calculate the market-to-book ratio of the company as of Feb 2, 2019. This is the Feb 2, 2019 market capitalization of the stock divided by the latest book value of shareholders' equity. Target's stock closed at $68.97 per share on the last trading day of the fiscal year, which was Feb 1, 2019. Shane price X share 2. Bankruptcy Risk. Calculate the Altman Z-Score as of the 2018 balance sheet date....
Why did Altria report a loss in the third quarter? Schedule 1 ALTRIA GROUP, INC. and...
 Why did Altria report a loss in the third quarter?
Schedule 1 ALTRIA GROUP, INC. and Subsidiaries Consolidated Statements of Earnings For the Quarters Ended September 30, (dollars in millions, except per share data) (Unaudited) 2019 2018 % Change 0.3% $ $ 6,856 1,915 1,444 3,497 494 7.4 % 13.8% Net revenues Cost of sales Excise taxes on products Gross profit Marketing, administration and research costs Asset impairment and exit costs Operating companies income Amortization of intangibles General corporate expenses...
Why did Altria report a loss in the third quarter?
Schedule 1 ALTRIA GROUP, INC. and Subsidiaries Consolidated Statements of Earnings For the Quarters Ended September 30, (dollars in millions, except per share data) (Unaudited) 2019 2018 % Change 0.3% $ $ 6,856 1,915 1,444 3,497 494 7.4 % 13.8% Net revenues Cost of sales Excise taxes on products Gross profit Marketing, administration and research costs Asset impairment and exit costs Operating companies income Amortization of intangibles General corporate expenses...
case 3-2 Micron Technology Inc
Case 3-2 Micron Technology, Inc. Micron Technology, Inc. designs, develops, and manufactures leading-edge semiconductor memory products. The Company is a leading global manufacturer of semiconductor memory products with manufacturing facilities located in the United States, Japan, Singapore, and Scotland. The Company's memory products are sold primanly to the PC, telecommunications, and networking hardware markets. The Company supplies several major PC original equip ment manufacturers with more than 30 percent of their memory requirements. Sales to Dell Computer Corporation exceeded 10...
 Can you explain why cash and equity change
when the company switches from LIFO to FIFO, and why there is no
change or up by 121.2 in net income and why does it different from
the net income from Q3?
3. What would DuPont's net income for 2015 have been if it had been using FIFO to account for all of its inventories? In answering this question, please assume a 40% tax rate. Please use the net income attributable to...
Can you explain why cash and equity change
when the company switches from LIFO to FIFO, and why there is no
change or up by 121.2 in net income and why does it different from
the net income from Q3?
3. What would DuPont's net income for 2015 have been if it had been using FIFO to account for all of its inventories? In answering this question, please assume a 40% tax rate. Please use the net income attributable to...
 Compute P&G's gross profit for each of the years 2015-2017.
Explain why gross profit decreased in 2017.
What are P&G's primary revenue sources
B-2 APPENDIX B Specimen Financial Statements: The Procter & Gamble Company 2017 $ 65,058 32,535 18,568 2016 2015 $ 65,299 $ 70,749 32,909 37,056 18,949 20,616 2,028 11,049 1395 Consolidated Statements of Earnings Amounts in millions except per share amounts: Years ended June 30 NET SALES Cost of products sold Selling, general and administrative expense Venezuela deconsolidation...
Compute P&G's gross profit for each of the years 2015-2017.
Explain why gross profit decreased in 2017.
What are P&G's primary revenue sources
B-2 APPENDIX B Specimen Financial Statements: The Procter & Gamble Company 2017 $ 65,058 32,535 18,568 2016 2015 $ 65,299 $ 70,749 32,909 37,056 18,949 20,616 2,028 11,049 1395 Consolidated Statements of Earnings Amounts in millions except per share amounts: Years ended June 30 NET SALES Cost of products sold Selling, general and administrative expense Venezuela deconsolidation...
 AR inancial Statements: Wal-Mart Stores, Inc. ores, Inc.'s financial statements as presented in the company's 2016 annual report. The complete annual report, including notes to site. Consolidated Statements of Income Facal than inded onuary at 2016 2015 2014 Revenues Neties Membership and other income Total revenues Costs and expenses 547 614 3,516 82110 70 3.218 06.294 5651 Operating ng general and administrave expenses Operating income 10084 97,041 24,105 93418 27.147 97253 26,82 2027 2161 Capital lease and financing obligations 2,467...
 compare income statment and balance sheet for the last two
years
any changes?
analyize cash flow
operating activities
investing activities
financing activities
of Financial Position Statements February 3, Janua millions, except footnotes) $ 2,643 $ 2,512 8,309 1.169 11,990 8,657 1,264 12,564 equivalents Cash and cash Other current assets Total current assets Property and equipment 6,095 28,396 5,623 2,645 6,106 27,611 5,503 2,651 Buildings and improvements Fixtures and equipment Computer hardware and software 440 200 Construction-in-progress Accumulated depreciation (18,181) (17,413)...
compare income statment and balance sheet for the last two
years
any changes?
analyize cash flow
operating activities
investing activities
financing activities
of Financial Position Statements February 3, Janua millions, except footnotes) $ 2,643 $ 2,512 8,309 1.169 11,990 8,657 1,264 12,564 equivalents Cash and cash Other current assets Total current assets Property and equipment 6,095 28,396 5,623 2,645 6,106 27,611 5,503 2,651 Buildings and improvements Fixtures and equipment Computer hardware and software 440 200 Construction-in-progress Accumulated depreciation (18,181) (17,413)...
 Calculate the altman Z-score that is the question
12. Calculate the market-to-book ratio of the company as of Feb 2, 2019. This is the Feb 2, 2019 market capitalization of the stock divided by the latest book value of shareholders' equity. Target's stock closed at $68.97 per share on the last trading day of the fiscal year, which was Feb 1, 2019. Shane price X share 2. Bankruptcy Risk. Calculate the Altman Z-Score as of the 2018 balance sheet date....
Calculate the altman Z-score that is the question
12. Calculate the market-to-book ratio of the company as of Feb 2, 2019. This is the Feb 2, 2019 market capitalization of the stock divided by the latest book value of shareholders' equity. Target's stock closed at $68.97 per share on the last trading day of the fiscal year, which was Feb 1, 2019. Shane price X share 2. Bankruptcy Risk. Calculate the Altman Z-Score as of the 2018 balance sheet date....
 Why did Altria report a loss in the third quarter?
Schedule 1 ALTRIA GROUP, INC. and Subsidiaries Consolidated Statements of Earnings For the Quarters Ended September 30, (dollars in millions, except per share data) (Unaudited) 2019 2018 % Change 0.3% $ $ 6,856 1,915 1,444 3,497 494 7.4 % 13.8% Net revenues Cost of sales Excise taxes on products Gross profit Marketing, administration and research costs Asset impairment and exit costs Operating companies income Amortization of intangibles General corporate expenses...
Why did Altria report a loss in the third quarter?
Schedule 1 ALTRIA GROUP, INC. and Subsidiaries Consolidated Statements of Earnings For the Quarters Ended September 30, (dollars in millions, except per share data) (Unaudited) 2019 2018 % Change 0.3% $ $ 6,856 1,915 1,444 3,497 494 7.4 % 13.8% Net revenues Cost of sales Excise taxes on products Gross profit Marketing, administration and research costs Asset impairment and exit costs Operating companies income Amortization of intangibles General corporate expenses...
Most questions answered within 3 hours.
-
For the reaction CaI2+2AgNO3⟶2AgI+Ca(NO3)2 how many grams of
silver iodide, AgI, are produced from 56.5 g...
asked 4 minutes ago -
Write an equation for hydrolysis via acid catalysis.
Using ethyl acetate, ethyl benzoate, ethyl formate or...
asked 12 minutes ago -
Only one graph is needed.
(a) Draw a Supply Curve and the Demand Curve for the...
asked 15 minutes ago -
Fill in the blanks and please show how you arrived at numerical
answers
. The...
asked 15 minutes ago -
91. If the half – life of a sample of radioactive
material is 60 days, what...
asked 22 minutes ago -
White light (380nm-750nm) strikes a diffraction grating (420
lines/mm) at normal incidence. What is the highest-order...
asked 32 minutes ago -
1) Explain what is meant by a good being "excludable."?
2) Explain what is meant by...
asked 31 minutes ago -
I need help with this question:
Describe in detail at least two factors that stimulated American...
asked 38 minutes ago -
Calculate the Boyle temperature for helium assuming it follows
the Berthelot equation of state.
asked 39 minutes ago -
Summarize Strategic Corporate Social Responsibility, 4th edition
2017 book, chapter one and two.
asked 39 minutes ago -
1. If the standard deviations for return on stock A and stock B
are 28% and...
asked 54 minutes ago -
Please use python to explain.
Assume that the variables x and
y refer to strings. Write...
asked 1 hour ago