

Homework Answers
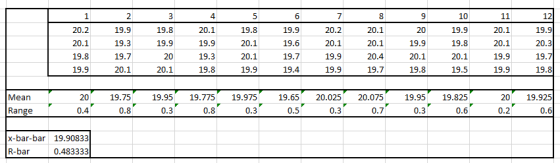
x-bar-bar = 19.90833
R-bar = 0.483333
Here, sample size (n) = 4
For n = 4:
A2 = 0.729
D3 = 0
D4 = 2.282
Question – a:
UCL-x-bar = x-bar-bar + A2*R-bar = 19.90833 + 0.729*0.483333 = 20.26068
LCL-x-bar = x-bar-bar - A2*R-bar = 19.90833 - 0.729*0.483333 = 19.55598
Graph: Option C (as per UCL and LCL)
Question – b:
UCL-R = D3*R-bar = 0
LCL-R = D4*R-bar = 2.282*0.483333 = 1.102966
Graph: Option C
********
IF YOU HAVE ANY DOUBT, KINDLY COMMENT. I WOULD LOVE TO HELP YOU!!!
IF YOU LIKE THE ANSWER, PLEASE GIVE AN UP-VOTE OR THUMB UP. THIS WILL ENCOURAGE ME TO ANSWER MORE!!
Add Answer to:
Refer to the table Factors for Computing Control Chart Limits (3 sigma) for this problem. A...
Refer to Table 56.1 - Factors for Computing Control Chart Limits (3 sigma) for this problem....
 Refer to Table 56.1 - Factors for Computing Control Chart Limits (3 sigma) for this problem. Thirty-five samples of size 7 each were taken from a fertilizer-bag-filing machine at Panos Kouvelis Lifelong Lawn Ltd. The results were: Overall mean = 54.75 16.; Average range R = 1.84 6. a) For the given sample size, the control limits for 3-sigma x chart are: Upper Control Limit (UCL) - b. (round your response to three decimal places). Lower Control Limit (LL)-11. round...
Refer to Table 56.1 - Factors for Computing Control Chart Limits (3 sigma) for this problem....
 Refer to Table 56.1 - Factors for Computing Control Chart Limits (3 sigma) for this problem. Thirty-five samples of size 7 each were taken from a fertilizer-bag-filling machine at Panos Kouvelis Lifelong Lawn Ltd. The results were: Overall mean = 60.75 lb.: Average range R = 1.78 lb. a) For the given sample size, the controllimits for 3-sigma x chart are: Upper Control Limit (UCL)- b. (round your response to three decimal places). Lower Control Limit (LCL:) - (round your...
Refer to the table Factors for Computing Control Chart Limits (3 sigma) for this problem. Pet...
 Refer to the table Factors for Computing Control Chart Limits (3 sigma) for this problem. Pet Products, Inc., caters to the growing market for cat supplies, with a full line of products ranging from litter to toys to flea powder. One of its newer products, a tube of fluid that prevents hairballs in long-haired cats, is produced by an automated machine set to fill each tube with 63 5 grams of paste To keep this filling process under control, four...
Refer to Table 56.1 - Factors for Computing Control Chart Limits (sigma) for this problem. Thirty-five...
 Refer to Table 56.1 - Factors for Computing Control Chart Limits (sigma) for this problem. Thirty-five samples of size 7 each were taken from a fertilizer-bag-filling machine at Panos Kouvels Lifelong Lawn Lid. The results were: Overal mean = 54.75 lb.: Average range R 164 b. a) For the given sample size, the control limits for 3-sigma x chart are Upper Control Limit (UCL) - D. (round your response to three decimal places). Lower Control Limit (LCL)-1. (round your response...
Problem 6s.11ac Question Help Refer to Table $6.1 - Factors for Computing Control Chart Limits (3...
 Problem 6s.11ac Question Help Refer to Table $6.1 - Factors for Computing Control Chart Limits (3 sigma) for this problem. Twelve samples, each containing five parts, were taken from a process that produces steel rods at Emmanual Kodzi's factory. The length of each rod in the samples was determined. The results were tabulated and sample means and ranges were computed. The results were: Sample Sample Mean Range qe (in.) (in.) 9.402 0.033 9.404 0.041 9.391 0.034 9.408 0.051 9.399 0.031...
Refer to Table 56.1 - Factors for Computing Control Chart Limits: 13.ma) for this problem Thirty-five...
 Refer to Table 56.1 - Factors for Computing Control Chart Limits: 13.ma) for this problem Thirty-five samples of size 7 cach were taken from a fertilizer-bag-filing machine at Panos Kouvelis Lifelong Lawn Lid. The results were: Overall mean = 54.75 : Average range R = 1.64 a) For the given sample size, the controlimits for 3-sigma x chartare Upper Control Limit (UCL) -16. round your response to three decimal places). Lower Control Limit (LC) -1. (round your response to three...
Refer to Table S6.1 - Factors for Computing Control Chart Limits (3 sigma) LOADING... for this...
Refer to Table S6.1 - Factors for Computing Control Chart Limits (3 sigma) LOADING... for this problem. Eagletrons are all-electric automobiles produced by Mogul Motors, Inc. One of the concerns of Mogul Motors is that the Eagletrons be capable of achieving appropriate maximum speeds. To monitor this, Mogul executives take samples of 8 Eagletrons at a time. For each sample, they determine the average maximum speed and the range of the maximum speeds within the sample. They repeat this with...
Omm Lecture Exercise #11 TABLE 56.1 Factors for Computing Control Chart Limits (3 sigma) SAMPLE SIZE,...
 Omm Lecture Exercise #11 TABLE 56.1 Factors for Computing Control Chart Limits (3 sigma) SAMPLE SIZE, MEAN FACTOR, UPPER RANGE, LOWER RANGE, n A2 D D 2 1.880 3.268 0 3 1.023 2.574 0 4 .729 2.282 0 5 .577 2.115 0 6 .483 2.004 0 7 .419 1.924 1.864 0.076 0.136 8 .373 9 .337 1.816 0.184 10 .308 1.777 0.223 12 .266 1.716 0.284 We wish to determine if screw production is in statistical control. We have no...
can u clearly show me how to find a sample size (N) , A2, and can...
 can u clearly show me how to find a sample size (N) , A2, and
can you also tell me why we are using an X Chart?
Problem 1 A restaurant wants to control kitchen preparation time of dinner meals using an X chart. The process standard deviation is unknown. Each evening a manager takes a random sample of 14 dinner orders and measures and records their kitchen preparation time. Create an X Chart using data in the table below...
can u clearly show me how to find a sample size (N) , A2, and
can you also tell me why we are using an X Chart?
Problem 1 A restaurant wants to control kitchen preparation time of dinner meals using an X chart. The process standard deviation is unknown. Each evening a manager takes a random sample of 14 dinner orders and measures and records their kitchen preparation time. Create an X Chart using data in the table below...
TABLE 56.1 SAMPLE SIZE, n Lecture Exercise #11 2 3 Factors for Computing Control Chart Limits...
 TABLE 56.1 SAMPLE SIZE, n Lecture Exercise #11 2 3 Factors for Computing Control Chart Limits (3 sigma) MEAN FACTOR, UPPER RANGE, LOWER RANGE, A DA D 1.880 3.268 0 1.023 2.574 0 .729 2.282 0 .577 2.115 0 .483 2.004 0 .419 1.924 0.076 .373 1.864 0.136 4 5 6 7 8 9 .337 1.816 0.184 10 .308 1.777 0.223 12 .266 1.716 0.284 We wish to determine if screw production is in statistical control. We have no prior...
 Refer to Table 56.1 - Factors for Computing Control Chart Limits (3 sigma) for this problem. Thirty-five samples of size 7 each were taken from a fertilizer-bag-filing machine at Panos Kouvelis Lifelong Lawn Ltd. The results were: Overall mean = 54.75 16.; Average range R = 1.84 6. a) For the given sample size, the control limits for 3-sigma x chart are: Upper Control Limit (UCL) - b. (round your response to three decimal places). Lower Control Limit (LL)-11. round...
 Refer to Table 56.1 - Factors for Computing Control Chart Limits (3 sigma) for this problem. Thirty-five samples of size 7 each were taken from a fertilizer-bag-filling machine at Panos Kouvelis Lifelong Lawn Ltd. The results were: Overall mean = 60.75 lb.: Average range R = 1.78 lb. a) For the given sample size, the controllimits for 3-sigma x chart are: Upper Control Limit (UCL)- b. (round your response to three decimal places). Lower Control Limit (LCL:) - (round your...
 Refer to the table Factors for Computing Control Chart Limits (3 sigma) for this problem. Pet Products, Inc., caters to the growing market for cat supplies, with a full line of products ranging from litter to toys to flea powder. One of its newer products, a tube of fluid that prevents hairballs in long-haired cats, is produced by an automated machine set to fill each tube with 63 5 grams of paste To keep this filling process under control, four...
 Refer to Table 56.1 - Factors for Computing Control Chart Limits (sigma) for this problem. Thirty-five samples of size 7 each were taken from a fertilizer-bag-filling machine at Panos Kouvels Lifelong Lawn Lid. The results were: Overal mean = 54.75 lb.: Average range R 164 b. a) For the given sample size, the control limits for 3-sigma x chart are Upper Control Limit (UCL) - D. (round your response to three decimal places). Lower Control Limit (LCL)-1. (round your response...
 Problem 6s.11ac Question Help Refer to Table $6.1 - Factors for Computing Control Chart Limits (3 sigma) for this problem. Twelve samples, each containing five parts, were taken from a process that produces steel rods at Emmanual Kodzi's factory. The length of each rod in the samples was determined. The results were tabulated and sample means and ranges were computed. The results were: Sample Sample Mean Range qe (in.) (in.) 9.402 0.033 9.404 0.041 9.391 0.034 9.408 0.051 9.399 0.031...
 Refer to Table 56.1 - Factors for Computing Control Chart Limits: 13.ma) for this problem Thirty-five samples of size 7 cach were taken from a fertilizer-bag-filing machine at Panos Kouvelis Lifelong Lawn Lid. The results were: Overall mean = 54.75 : Average range R = 1.64 a) For the given sample size, the controlimits for 3-sigma x chartare Upper Control Limit (UCL) -16. round your response to three decimal places). Lower Control Limit (LC) -1. (round your response to three...
 Omm Lecture Exercise #11 TABLE 56.1 Factors for Computing Control Chart Limits (3 sigma) SAMPLE SIZE, MEAN FACTOR, UPPER RANGE, LOWER RANGE, n A2 D D 2 1.880 3.268 0 3 1.023 2.574 0 4 .729 2.282 0 5 .577 2.115 0 6 .483 2.004 0 7 .419 1.924 1.864 0.076 0.136 8 .373 9 .337 1.816 0.184 10 .308 1.777 0.223 12 .266 1.716 0.284 We wish to determine if screw production is in statistical control. We have no...
 can u clearly show me how to find a sample size (N) , A2, and
can you also tell me why we are using an X Chart?
Problem 1 A restaurant wants to control kitchen preparation time of dinner meals using an X chart. The process standard deviation is unknown. Each evening a manager takes a random sample of 14 dinner orders and measures and records their kitchen preparation time. Create an X Chart using data in the table below...
can u clearly show me how to find a sample size (N) , A2, and
can you also tell me why we are using an X Chart?
Problem 1 A restaurant wants to control kitchen preparation time of dinner meals using an X chart. The process standard deviation is unknown. Each evening a manager takes a random sample of 14 dinner orders and measures and records their kitchen preparation time. Create an X Chart using data in the table below...
 TABLE 56.1 SAMPLE SIZE, n Lecture Exercise #11 2 3 Factors for Computing Control Chart Limits (3 sigma) MEAN FACTOR, UPPER RANGE, LOWER RANGE, A DA D 1.880 3.268 0 1.023 2.574 0 .729 2.282 0 .577 2.115 0 .483 2.004 0 .419 1.924 0.076 .373 1.864 0.136 4 5 6 7 8 9 .337 1.816 0.184 10 .308 1.777 0.223 12 .266 1.716 0.284 We wish to determine if screw production is in statistical control. We have no prior...
Most questions answered within 3 hours.
-
HELP WITH SAS
Run the following DATA step to create a SAS data set called
ABC_CORP....
asked 45 seconds from now -
A researcher wishes to study the cumulative effects of several
combinations of HIV drugs. There are...
asked 18 minutes ago -
How
to make a simple game of whack a mole in pygame
asked 2 minutes ago -
Write a c/c++ program to read a list of students from a file and
create a...
asked 11 minutes ago -
Identify two different methods for collecting data in
qualitative research. What are the benefits and challenges...
asked 12 minutes ago -
I am suppose to have my array before the main class but I am
getting the...
asked 13 minutes ago -
Your task is to design the page table for the 32bit Pentium
microprocessor. Answer the following...
asked 20 minutes ago -
The Paradise Shoes Company has estimated its weekly TVC function
from data collected over the past...
asked 18 minutes ago -
Although Epicurus advocates pursuing pleasure for the
good life, discuss a few reasons why he does...
asked 36 minutes ago -
Problem 1: Present entries to record the selected transactions
described below:
(a)
Issued $2,790,000 of 5-year,...
asked 42 minutes ago -
Using technology to support HR activities increases:
a.
the efficiency of the administrative HR functions.
b....
asked 43 minutes ago -
1. List the features used to classify leaf
types.
2. List some characteristics that are shared...
asked 48 minutes ago