Please dont answer by hand writing and show steps clearly. Thank you
Homework Answers
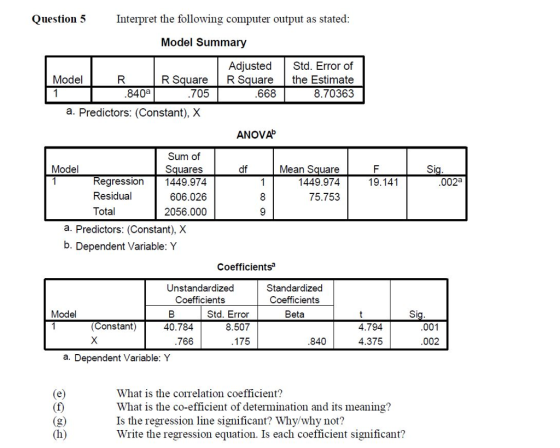
a) the correlation coefficients is nothing but R which is 0.840.
b)the coefficient of determination is R2= 0.705, which means 70.5% of the variation of the dependent variable(Y) is explained by the independent variable(X).
c)Yes, because in the ANOVA table, p-value = 0.002, which is very small. hence, we can conclude that at 0.01 level of significance, the regression line is significant.
d)the regression equation is,
 = 40.784+0.766X
Yes, both the coefficients are significant since p-value for both the coefficients is 0.001 and 0.002 which are significant.
Add Answer to:
Please dont answer by hand writing and show steps clearly. Thank
you
Question 5 Interpret the...
From the three three Regression tests, come up with three hypotheses. Regression Method Variables Entered/Removeda Variables...
 From the three three Regression tests, come up with three
hypotheses.
Regression Method Variables Entered/Removeda Variables Model Variables Entered Removed 1 TotElectb a. Dependent Variable: Variety Seeking b. All requested variables entered. Enter Model Summary Adjusted R R Square Square .009 .002 Model R Std. Error of the Estimate .64205 1 .0958 a. Predictors: (Constant), TotElect Coefficients a Standardized Coefficients Model Unstandardized Coefficients B Std. Error 3.667 . 108 Beta t Sig. .000 1 (Constant) 34.075 TotElect .008 .007 .095...
From the three three Regression tests, come up with three
hypotheses.
Regression Method Variables Entered/Removeda Variables Model Variables Entered Removed 1 TotElectb a. Dependent Variable: Variety Seeking b. All requested variables entered. Enter Model Summary Adjusted R R Square Square .009 .002 Model R Std. Error of the Estimate .64205 1 .0958 a. Predictors: (Constant), TotElect Coefficients a Standardized Coefficients Model Unstandardized Coefficients B Std. Error 3.667 . 108 Beta t Sig. .000 1 (Constant) 34.075 TotElect .008 .007 .095...
A researcher uses two regression models to seek answers to two research questions. These models a...
 A researcher uses two
regression models to seek answers to two research questions. These
models are:
Y1 = Bo1 + B11X1
Y2 = Bo2 + B12X1 + B22X12
Test the null hypotheses for both models. Use the results of
your analyses to recommend an appropriate model. In each of the
above two cases, state your null and alternative hypotheses,
decision criteria, decision and conclusion.
The level of significance is 5%. The data for this study are
presented in the table...
A researcher uses two
regression models to seek answers to two research questions. These
models are:
Y1 = Bo1 + B11X1
Y2 = Bo2 + B12X1 + B22X12
Test the null hypotheses for both models. Use the results of
your analyses to recommend an appropriate model. In each of the
above two cases, state your null and alternative hypotheses,
decision criteria, decision and conclusion.
The level of significance is 5%. The data for this study are
presented in the table...
Models 1-7 are below Part C: Select one model you would use to explain reading ability.,Then use that model to find the 95% confidence interval estimate for the mean reading ability 95% p...
 Models 1-7 are below
Part C: Select one model you would use to explain reading ability.,Then use that model to find the 95% confidence interval estimate for the mean reading ability 95% prediction interval for reading ability When age 6, mem span 4.2 and ig 91. Regression [DataSetll C:\Usersn.little5773 Downloads\child data.sav Variables Entered/Removed Variables Entered Variables Removed Method Model Enter age a. Dependent Variable: reading ability b. All requested variables entered. Model Summary Adjusted R Square Std. Error o R...
Models 1-7 are below
Part C: Select one model you would use to explain reading ability.,Then use that model to find the 95% confidence interval estimate for the mean reading ability 95% prediction interval for reading ability When age 6, mem span 4.2 and ig 91. Regression [DataSetll C:\Usersn.little5773 Downloads\child data.sav Variables Entered/Removed Variables Entered Variables Removed Method Model Enter age a. Dependent Variable: reading ability b. All requested variables entered. Model Summary Adjusted R Square Std. Error o R...
Investigate the relationship between the respondent’s education (EDUC) and the education received...
 Investigate the relationship
between the respondent’s education (EDUC) and the education
received by his or her father and mother (PAEDUC and MAEDUC,
respectively). Calculate the correlation coefficient, the
coefficient of determination, and the regression equation
predicting the respondent’s education with father’s education only.
Interpret your results. Determine the multiple correlation
coefficient, the multiple coefficient of determination, and the
regression equation predicting the respondent’s education with
father’s and mother’s education. Interpret your results. Did taking
into account the respondent’s mother’s education...
Investigate the relationship
between the respondent’s education (EDUC) and the education
received by his or her father and mother (PAEDUC and MAEDUC,
respectively). Calculate the correlation coefficient, the
coefficient of determination, and the regression equation
predicting the respondent’s education with father’s education only.
Interpret your results. Determine the multiple correlation
coefficient, the multiple coefficient of determination, and the
regression equation predicting the respondent’s education with
father’s and mother’s education. Interpret your results. Did taking
into account the respondent’s mother’s education...
Model Summary Adjusted R Square Std. Error of the Estimate Model R R Square 1 .843a...
 Model Summary Adjusted R Square Std. Error of the Estimate Model R R Square 1 .843a .711 .707 7.812812 a. Predictors: (Constant), Fuel efficiency, Horsepower Coefficientsa Standardized Coefficients Beta Sig 2.354 .020 Unstandardized Coefficients Model B Std. Error 1 (Constant) 28.144 11.954 Horsepower 229 .013 Length - 219 Fuel efficiency -.090 .185 a. Dependent Variable: Price in thousands .906 16.989 ,000 .050 - 205 -4.348 .000 -.027 -.488 .627 Model Summary Adjusted R Square Std. Error of the Estimate Model...
Overview of the Study: The data are based on a Comprehensive School Reform (CSR) Initiative that...
Overview of the Study: The data are based on a Comprehensive School Reform (CSR) Initiative that focused on the improvement of reading and writing for students in the primary grade. The school received a grant from the state which was used to strengthen classroom teachers’ instructional skills. The regression outputs present information for students in the school. Description of the variables: Please use the following description/coding to help you in your analyses. Gender: female; 1 male=0 Coding – Gender female...
The following questions refer to the output shown below. Researchers used temperature to predict failure time...
 The following questions refer to the output shown below.
Researchers used temperature to predict failure time for a
superconductive material with the following
a. Write the regression equation based on the results shown
below.
b. Assess the model utility.
linear model: yˆ = β0 + β1xtemp
Write the regression equation based on the results shown
below.
Would you recommend the model? Why or why not?
Model Summary Adjusted R Model R R Square Square .918a .843 .835 a. Predictors: (Constant),...
The following questions refer to the output shown below.
Researchers used temperature to predict failure time for a
superconductive material with the following
a. Write the regression equation based on the results shown
below.
b. Assess the model utility.
linear model: yˆ = β0 + β1xtemp
Write the regression equation based on the results shown
below.
Would you recommend the model? Why or why not?
Model Summary Adjusted R Model R R Square Square .918a .843 .835 a. Predictors: (Constant),...
please help with step by step calculations Variables Entered/Removed Variables Removed Model Variables Entered) Method contraception...
 please help with step by step calculations
Variables Entered/Removed Variables Removed Model Variables Entered) Method contraception use (%) Enter a. All requested variables entered. b. Dependent Variable: fertility rate per woman Model Summary Std. Error of the Estimate Model R .71764 Adjusted R2 Square .469 220 168 a. Predictors: (Constant), contraception use %) ANOVA Model Sum of Squares Idf Regression 2.177 Residual 7.725 Total 9.902 Mean Square 2.177 .515 a. Predictors: (Constant), contraception use (%) b. Dependent Variable: fertility rate...
please help with step by step calculations
Variables Entered/Removed Variables Removed Model Variables Entered) Method contraception use (%) Enter a. All requested variables entered. b. Dependent Variable: fertility rate per woman Model Summary Std. Error of the Estimate Model R .71764 Adjusted R2 Square .469 220 168 a. Predictors: (Constant), contraception use %) ANOVA Model Sum of Squares Idf Regression 2.177 Residual 7.725 Total 9.902 Mean Square 2.177 .515 a. Predictors: (Constant), contraception use (%) b. Dependent Variable: fertility rate...
QUESTION 6 Model Summary Model R R Square Adjusted R Square Std. Error of the Estimate...
QUESTION 6 Model Summary Model R R Square Adjusted R Square Std. Error of the Estimate 1 .641a .410 .406 4.507 a. Predictors: (Constant), age 3 groups, Total Mastery, Total Optimism Coefficientsa Model Unstandardized Coefficients Standardized Coefficients t Sig. B Std. Error Beta 1 (Constant) 50.016 1.409 35.508 .000 Total Mastery -.786 .067 -.526 -11.719 .000 Total Optimism -.217 .060 -.164 -3.623 .000 age 3 groups -.712 .275 -.098 -2.588 .010 a. Dependent Variable: Total perceived stress What proportion of...
Model Summary Model R R Square Adjusted R Square Std. Error of the Estimate 1 .884a...
Model Summary Model R R Square Adjusted R Square Std. Error of the Estimate 1 .884a .782 .775 1134.08895 a. Predictors: (Constant), Tuition2000 Coefficientsa Model Unstandardized Coefficients Standardized Coefficients t Sig. B Std. Error Beta 1 (Constant) 1133.148 701.455 1.615 .116 Tuition2000 1.692 .160 .884 10.551 .000 a. Dependent Variable: Tuition2008 What is the regression equation? What is the percent of variation in BMI explained by the regression line? Predict 2008 Tuition for Oregon given their 2000 tuition rate. Predict...
 From the three three Regression tests, come up with three
hypotheses.
Regression Method Variables Entered/Removeda Variables Model Variables Entered Removed 1 TotElectb a. Dependent Variable: Variety Seeking b. All requested variables entered. Enter Model Summary Adjusted R R Square Square .009 .002 Model R Std. Error of the Estimate .64205 1 .0958 a. Predictors: (Constant), TotElect Coefficients a Standardized Coefficients Model Unstandardized Coefficients B Std. Error 3.667 . 108 Beta t Sig. .000 1 (Constant) 34.075 TotElect .008 .007 .095...
From the three three Regression tests, come up with three
hypotheses.
Regression Method Variables Entered/Removeda Variables Model Variables Entered Removed 1 TotElectb a. Dependent Variable: Variety Seeking b. All requested variables entered. Enter Model Summary Adjusted R R Square Square .009 .002 Model R Std. Error of the Estimate .64205 1 .0958 a. Predictors: (Constant), TotElect Coefficients a Standardized Coefficients Model Unstandardized Coefficients B Std. Error 3.667 . 108 Beta t Sig. .000 1 (Constant) 34.075 TotElect .008 .007 .095...
 A researcher uses two
regression models to seek answers to two research questions. These
models are:
Y1 = Bo1 + B11X1
Y2 = Bo2 + B12X1 + B22X12
Test the null hypotheses for both models. Use the results of
your analyses to recommend an appropriate model. In each of the
above two cases, state your null and alternative hypotheses,
decision criteria, decision and conclusion.
The level of significance is 5%. The data for this study are
presented in the table...
A researcher uses two
regression models to seek answers to two research questions. These
models are:
Y1 = Bo1 + B11X1
Y2 = Bo2 + B12X1 + B22X12
Test the null hypotheses for both models. Use the results of
your analyses to recommend an appropriate model. In each of the
above two cases, state your null and alternative hypotheses,
decision criteria, decision and conclusion.
The level of significance is 5%. The data for this study are
presented in the table...
 Models 1-7 are below
Part C: Select one model you would use to explain reading ability.,Then use that model to find the 95% confidence interval estimate for the mean reading ability 95% prediction interval for reading ability When age 6, mem span 4.2 and ig 91. Regression [DataSetll C:\Usersn.little5773 Downloads\child data.sav Variables Entered/Removed Variables Entered Variables Removed Method Model Enter age a. Dependent Variable: reading ability b. All requested variables entered. Model Summary Adjusted R Square Std. Error o R...
Models 1-7 are below
Part C: Select one model you would use to explain reading ability.,Then use that model to find the 95% confidence interval estimate for the mean reading ability 95% prediction interval for reading ability When age 6, mem span 4.2 and ig 91. Regression [DataSetll C:\Usersn.little5773 Downloads\child data.sav Variables Entered/Removed Variables Entered Variables Removed Method Model Enter age a. Dependent Variable: reading ability b. All requested variables entered. Model Summary Adjusted R Square Std. Error o R...
 Investigate the relationship
between the respondent’s education (EDUC) and the education
received by his or her father and mother (PAEDUC and MAEDUC,
respectively). Calculate the correlation coefficient, the
coefficient of determination, and the regression equation
predicting the respondent’s education with father’s education only.
Interpret your results. Determine the multiple correlation
coefficient, the multiple coefficient of determination, and the
regression equation predicting the respondent’s education with
father’s and mother’s education. Interpret your results. Did taking
into account the respondent’s mother’s education...
Investigate the relationship
between the respondent’s education (EDUC) and the education
received by his or her father and mother (PAEDUC and MAEDUC,
respectively). Calculate the correlation coefficient, the
coefficient of determination, and the regression equation
predicting the respondent’s education with father’s education only.
Interpret your results. Determine the multiple correlation
coefficient, the multiple coefficient of determination, and the
regression equation predicting the respondent’s education with
father’s and mother’s education. Interpret your results. Did taking
into account the respondent’s mother’s education...
 Model Summary Adjusted R Square Std. Error of the Estimate Model R R Square 1 .843a .711 .707 7.812812 a. Predictors: (Constant), Fuel efficiency, Horsepower Coefficientsa Standardized Coefficients Beta Sig 2.354 .020 Unstandardized Coefficients Model B Std. Error 1 (Constant) 28.144 11.954 Horsepower 229 .013 Length - 219 Fuel efficiency -.090 .185 a. Dependent Variable: Price in thousands .906 16.989 ,000 .050 - 205 -4.348 .000 -.027 -.488 .627 Model Summary Adjusted R Square Std. Error of the Estimate Model...
 The following questions refer to the output shown below.
Researchers used temperature to predict failure time for a
superconductive material with the following
a. Write the regression equation based on the results shown
below.
b. Assess the model utility.
linear model: yˆ = β0 + β1xtemp
Write the regression equation based on the results shown
below.
Would you recommend the model? Why or why not?
Model Summary Adjusted R Model R R Square Square .918a .843 .835 a. Predictors: (Constant),...
The following questions refer to the output shown below.
Researchers used temperature to predict failure time for a
superconductive material with the following
a. Write the regression equation based on the results shown
below.
b. Assess the model utility.
linear model: yˆ = β0 + β1xtemp
Write the regression equation based on the results shown
below.
Would you recommend the model? Why or why not?
Model Summary Adjusted R Model R R Square Square .918a .843 .835 a. Predictors: (Constant),...
 please help with step by step calculations
Variables Entered/Removed Variables Removed Model Variables Entered) Method contraception use (%) Enter a. All requested variables entered. b. Dependent Variable: fertility rate per woman Model Summary Std. Error of the Estimate Model R .71764 Adjusted R2 Square .469 220 168 a. Predictors: (Constant), contraception use %) ANOVA Model Sum of Squares Idf Regression 2.177 Residual 7.725 Total 9.902 Mean Square 2.177 .515 a. Predictors: (Constant), contraception use (%) b. Dependent Variable: fertility rate...
please help with step by step calculations
Variables Entered/Removed Variables Removed Model Variables Entered) Method contraception use (%) Enter a. All requested variables entered. b. Dependent Variable: fertility rate per woman Model Summary Std. Error of the Estimate Model R .71764 Adjusted R2 Square .469 220 168 a. Predictors: (Constant), contraception use %) ANOVA Model Sum of Squares Idf Regression 2.177 Residual 7.725 Total 9.902 Mean Square 2.177 .515 a. Predictors: (Constant), contraception use (%) b. Dependent Variable: fertility rate...
Most questions answered within 3 hours.
-
1. (A) Write two
structural (constitutional)
isomers of C4H8F2?
Please show all of
the
asked 54 seconds ago -
1) Name the three holes located in the greater wing of the
sphenoid bone in order...
asked 1 minute ago -
For the following reaction set-up, which type of hydrocarbon
product would form? 1,4-hexadiene + two Cl2...
asked 3 minutes ago -
Consider the following method that is intended to determine if
the double values d1 and d2...
asked 16 minutes ago -
could someone please post clear drawings of the three structures
in the equilibrium mixture of D-glucose...
asked 23 minutes ago -
Using the Properties of Order show that 5n5 +
4n4 + 6n3 + 2n2+ n +...
asked 26 minutes ago -
What is experiential learning and how is it helpful for teaching
leadership, and interpreting group dynamics?...
asked 26 minutes ago -
A security awareness policy defines the responsibilities of
managers and information owners.
True
False
asked 27 minutes ago -
which is the equilibrium expression for the reaction
3A(g)+4B(g)<---> 2C(g)+5D(g)
asked 28 minutes ago -
Create a balanced compensation plan that you feel would
encourage a restaurant manager to be more...
asked 35 minutes ago -
Re: Human Physiology
Comment on the differences between representing V02 max as an
absolute number and...
asked 38 minutes ago -
A firm with a WACC of 10% is considering the following mutually
exclusive projects:
0
1...
asked 43 minutes ago