We use the transportation tableau to find the optimal solution
please show working
Homework Answers
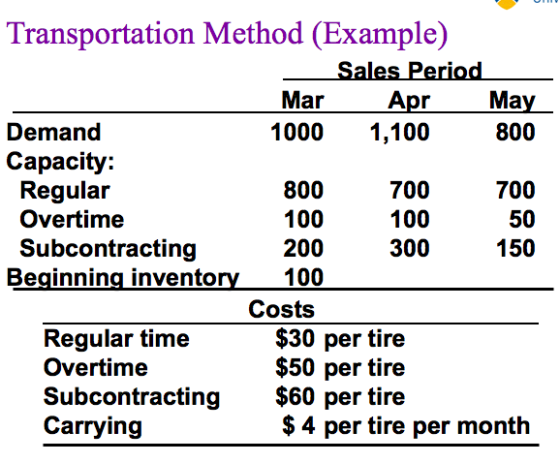
In order to formulate the problem as a transportation model, we need to create the parameter table. Rows of the parameter table show supply period and columns indicate demand period. Regular cost of production in a supply period to fulfil the demand of same period is as given in the problem. For example regular production cost in period 1 to fulfil the demand of period 1 is $ 30 and overtime cost in the same supply and demand period is $ 50. Subcontract cost is $ 60.
Regular time Cost of fulfilling demand of n months later than the current month increases by n times the carrying cost. For example, cost of fulfilling demand of month 3 (2 periods later) from overtime time supply of month 1 = 50+3*4 = 62
While calculating net demand, opening inventory is subtracted from first month demand and required closing inventory is added to the last month demand.

EXCEL Formulas:
| Cell | Formula | Copy to |
| K11 | =SUM(H11:J11) | K11:K19 |
| H20 | =SUM(H11:H19) | H20:J20 |
| K8 | =SUMPRODUCT(B11:D19,H11:J19) |
Total cost = $ 99,500
Add Answer to:
We use the transportation tableau to find the optimal
solution
please show working
Transportation Method (Example)...
cheek the answer plz Solve this Aggregate Planning Problem by minimizing the cost of matching the...
 cheek the answer plz
Solve this Aggregate Planning Problem by minimizing the cost of matching the capacity various options in various periods to the future demand? Find inventory cost, regular time cost, overtime cost and subcontract cost, and the total cost? Sales Period Mar Apr May Pemand 700 1000 1100 Capacity: Regular Time 1000 800 800 Overtime 100 100 100 200 200 100 Subcontracting Beginning inventory is zero O Cost Regular Time Overtime $20 per tire $30 per tire $50...
cheek the answer plz
Solve this Aggregate Planning Problem by minimizing the cost of matching the capacity various options in various periods to the future demand? Find inventory cost, regular time cost, overtime cost and subcontract cost, and the total cost? Sales Period Mar Apr May Pemand 700 1000 1100 Capacity: Regular Time 1000 800 800 Overtime 100 100 100 200 200 100 Subcontracting Beginning inventory is zero O Cost Regular Time Overtime $20 per tire $30 per tire $50...
Ram Roy's firm has developed the following supply, demand, cost, and inventory data Supply Available Regular...
 Ram Roy's firm has developed the following supply, demand, cost, and inventory data Supply Available Regular Time 30 30 40 Demand Period Overtime Subcontract Forecast 15 15 20 40 45 60 Initial inventory Regular-time cost per unit Overtime cost per unit Subcontract cost per unit Carrying cost per unit per month 20 units $100 $150 $200 $6 Assume that the initial inventory has no holding cost in the first period and backorders are not permitted Allocating production capacity to meet...
Please answer questions using Microsoft excel, and please show formulas. Thank you. School of Business BUS...
 Please answer questions using Microsoft excel, and please show
formulas. Thank you.
School of Business BUS 476-Operations Management Dr. Enrique G. Zapatero, Professor Homework #8-Aggregate Planning Instructions: Use MS Excel to produce the computations to support your answers to ProblemsI, and I. Problem I: A production manager needs to develop a production schedule to meet the following demand Period Demand 600 600 800 1000 1200 600 2 Productions costs are as follows: (a) regular time: $3 per unit. (b) over-time:...
Please answer questions using Microsoft excel, and please show
formulas. Thank you.
School of Business BUS 476-Operations Management Dr. Enrique G. Zapatero, Professor Homework #8-Aggregate Planning Instructions: Use MS Excel to produce the computations to support your answers to ProblemsI, and I. Problem I: A production manager needs to develop a production schedule to meet the following demand Period Demand 600 600 800 1000 1200 600 2 Productions costs are as follows: (a) regular time: $3 per unit. (b) over-time:...
Please help me fill those in and also what is Plan B's cost = ____$? (enter...
 Please help me fill those
in
and also what is Plan B's cost = ____$? (enter your response as
a whole number)
Refrigeration Corp. needs an aggregate plan for January through June for its refrigerator production. The company has developed the following data: Click the icon to view the company's data. Consider the two following strategies. a) Plan A: Vary the workforce so that production meets the forecasted demand (maintain inventory at 250 units). Bell had eight employees on staff...
Please help me fill those
in
and also what is Plan B's cost = ____$? (enter your response as
a whole number)
Refrigeration Corp. needs an aggregate plan for January through June for its refrigerator production. The company has developed the following data: Click the icon to view the company's data. Consider the two following strategies. a) Plan A: Vary the workforce so that production meets the forecasted demand (maintain inventory at 250 units). Bell had eight employees on staff...
Aggregate Planning
A While the demand for regular fabric has declined, the demand for medical-grade fabric has been surging in the market. In response, the management at Fabric Mills quickly bumped up the regular output of medical-grade fabric by reassigning workers from the production of regular fabric and rehiring retired workers. Table 2 shows the demand forecast and capacity for medical-grade fabric. Note that overtime is limited to 20% of the regular capacity. The availability of subcontract is also limited due to...
Please help with the missing numbers above Also Total hiring cost $ _?(enter response as whole...
 Please help with the missing
numbers above
Also
Total hiring cost $ _?(enter response as whole number)
Total layoff cost $ _?(enter response as whole number)
Total inventory carrying cost $ _?(enter response as whole
number)
Total stockout cost $ _?(enter response as whole number)
Total cost, excluding normal time labor costs, for Plan B $
_?(enter response as whole number)
The S&OP team at Kansas Furniture, has received estimates of demand requirements as shown in the table. Assuming one-time...
Please help with the missing
numbers above
Also
Total hiring cost $ _?(enter response as whole number)
Total layoff cost $ _?(enter response as whole number)
Total inventory carrying cost $ _?(enter response as whole
number)
Total stockout cost $ _?(enter response as whole number)
Total cost, excluding normal time labor costs, for Plan B $
_?(enter response as whole number)
The S&OP team at Kansas Furniture, has received estimates of demand requirements as shown in the table. Assuming one-time...
Need help with question 9 please!!!!! Quantity of jets demanded Quantity of jets supplied Price of...
 Need help with question 9 please!!!!!
Quantity of jets demanded Quantity of jets supplied Price of Jet (millions) 140 120 110 100 90 80 70 60 50 40 20 100 150 200 250 300 350 400 450 500 600 1200 1000 900 800 700 600 500 400 300 200 0 2 2Z 2oo Irot unnly and demand curves. What are the equilibriumprice and Illustrate graphically the economic effects ofan $90. Compute the producer surplus. PsH6。Q-400 8 export subsidy of 15%...
Need help with question 9 please!!!!!
Quantity of jets demanded Quantity of jets supplied Price of Jet (millions) 140 120 110 100 90 80 70 60 50 40 20 100 150 200 250 300 350 400 450 500 600 1200 1000 900 800 700 600 500 400 300 200 0 2 2Z 2oo Irot unnly and demand curves. What are the equilibriumprice and Illustrate graphically the economic effects ofan $90. Compute the producer surplus. PsH6。Q-400 8 export subsidy of 15%...
Consider the Bolivian market for lemons. The following graph shows the domestic demand and domestic supply...
 Consider the Bolivian market for lemons. The following graph shows the domestic demand and domestic supply curves for lemons in Bolivia. Suppose Bolivia's government currently does not allow international trade in lemons. Use the black point (plus symbol) to indicate the equilibrium price of a ton of lemons and the equilibrium quantity of lemons in Bolivia in the absence of international trade. Then, use the green triangle (triangle symbol) to shade the area representing consumer surplus in equilibrium. Finally, use...
NYY is a winter jacket manufacturer company with manufacturing facilities in the U.S.A. Winter jacket demand...
NYY is a winter jacket manufacturer company with manufacturing facilities in the U.S.A. Winter jacket demand is seasonal peaking in the winter as the temperatures along the East Coast dipping well below zero. Production of winter jackets requires some certain amount of work and NYY jacket manufacturer has multiple options to handle seasonal demand. The first option is NYY can prefer to increase number of workers by adding workers during the peak season. Second option is NYY can subcontract out...
Consider a hypothetical market for good X using the information below. Price Quantity demanded Quantity supplied...
 Consider a hypothetical market for good X using the information below. Price Quantity demanded Quantity supplied 700 300 600 400 500 500 400 600 300 700 200 800 100 900 0 1000 Suppose that the production of good X generates pollution in the form of chemical runoff and that the pollution imposes a $4 cost on society for each gallon of good X produced. What is the optimal quantity of good X production? Does the market overproduce or underproduce? O...
 cheek the answer plz
Solve this Aggregate Planning Problem by minimizing the cost of matching the capacity various options in various periods to the future demand? Find inventory cost, regular time cost, overtime cost and subcontract cost, and the total cost? Sales Period Mar Apr May Pemand 700 1000 1100 Capacity: Regular Time 1000 800 800 Overtime 100 100 100 200 200 100 Subcontracting Beginning inventory is zero O Cost Regular Time Overtime $20 per tire $30 per tire $50...
cheek the answer plz
Solve this Aggregate Planning Problem by minimizing the cost of matching the capacity various options in various periods to the future demand? Find inventory cost, regular time cost, overtime cost and subcontract cost, and the total cost? Sales Period Mar Apr May Pemand 700 1000 1100 Capacity: Regular Time 1000 800 800 Overtime 100 100 100 200 200 100 Subcontracting Beginning inventory is zero O Cost Regular Time Overtime $20 per tire $30 per tire $50...
 Ram Roy's firm has developed the following supply, demand, cost, and inventory data Supply Available Regular Time 30 30 40 Demand Period Overtime Subcontract Forecast 15 15 20 40 45 60 Initial inventory Regular-time cost per unit Overtime cost per unit Subcontract cost per unit Carrying cost per unit per month 20 units $100 $150 $200 $6 Assume that the initial inventory has no holding cost in the first period and backorders are not permitted Allocating production capacity to meet...
 Please answer questions using Microsoft excel, and please show
formulas. Thank you.
School of Business BUS 476-Operations Management Dr. Enrique G. Zapatero, Professor Homework #8-Aggregate Planning Instructions: Use MS Excel to produce the computations to support your answers to ProblemsI, and I. Problem I: A production manager needs to develop a production schedule to meet the following demand Period Demand 600 600 800 1000 1200 600 2 Productions costs are as follows: (a) regular time: $3 per unit. (b) over-time:...
Please answer questions using Microsoft excel, and please show
formulas. Thank you.
School of Business BUS 476-Operations Management Dr. Enrique G. Zapatero, Professor Homework #8-Aggregate Planning Instructions: Use MS Excel to produce the computations to support your answers to ProblemsI, and I. Problem I: A production manager needs to develop a production schedule to meet the following demand Period Demand 600 600 800 1000 1200 600 2 Productions costs are as follows: (a) regular time: $3 per unit. (b) over-time:...
 Please help me fill those
in
and also what is Plan B's cost = ____$? (enter your response as
a whole number)
Refrigeration Corp. needs an aggregate plan for January through June for its refrigerator production. The company has developed the following data: Click the icon to view the company's data. Consider the two following strategies. a) Plan A: Vary the workforce so that production meets the forecasted demand (maintain inventory at 250 units). Bell had eight employees on staff...
Please help me fill those
in
and also what is Plan B's cost = ____$? (enter your response as
a whole number)
Refrigeration Corp. needs an aggregate plan for January through June for its refrigerator production. The company has developed the following data: Click the icon to view the company's data. Consider the two following strategies. a) Plan A: Vary the workforce so that production meets the forecasted demand (maintain inventory at 250 units). Bell had eight employees on staff...
 Please help with the missing
numbers above
Also
Total hiring cost $ _?(enter response as whole number)
Total layoff cost $ _?(enter response as whole number)
Total inventory carrying cost $ _?(enter response as whole
number)
Total stockout cost $ _?(enter response as whole number)
Total cost, excluding normal time labor costs, for Plan B $
_?(enter response as whole number)
The S&OP team at Kansas Furniture, has received estimates of demand requirements as shown in the table. Assuming one-time...
Please help with the missing
numbers above
Also
Total hiring cost $ _?(enter response as whole number)
Total layoff cost $ _?(enter response as whole number)
Total inventory carrying cost $ _?(enter response as whole
number)
Total stockout cost $ _?(enter response as whole number)
Total cost, excluding normal time labor costs, for Plan B $
_?(enter response as whole number)
The S&OP team at Kansas Furniture, has received estimates of demand requirements as shown in the table. Assuming one-time...
 Need help with question 9 please!!!!!
Quantity of jets demanded Quantity of jets supplied Price of Jet (millions) 140 120 110 100 90 80 70 60 50 40 20 100 150 200 250 300 350 400 450 500 600 1200 1000 900 800 700 600 500 400 300 200 0 2 2Z 2oo Irot unnly and demand curves. What are the equilibriumprice and Illustrate graphically the economic effects ofan $90. Compute the producer surplus. PsH6。Q-400 8 export subsidy of 15%...
Need help with question 9 please!!!!!
Quantity of jets demanded Quantity of jets supplied Price of Jet (millions) 140 120 110 100 90 80 70 60 50 40 20 100 150 200 250 300 350 400 450 500 600 1200 1000 900 800 700 600 500 400 300 200 0 2 2Z 2oo Irot unnly and demand curves. What are the equilibriumprice and Illustrate graphically the economic effects ofan $90. Compute the producer surplus. PsH6。Q-400 8 export subsidy of 15%...
 Consider the Bolivian market for lemons. The following graph shows the domestic demand and domestic supply curves for lemons in Bolivia. Suppose Bolivia's government currently does not allow international trade in lemons. Use the black point (plus symbol) to indicate the equilibrium price of a ton of lemons and the equilibrium quantity of lemons in Bolivia in the absence of international trade. Then, use the green triangle (triangle symbol) to shade the area representing consumer surplus in equilibrium. Finally, use...
 Consider a hypothetical market for good X using the information below. Price Quantity demanded Quantity supplied 700 300 600 400 500 500 400 600 300 700 200 800 100 900 0 1000 Suppose that the production of good X generates pollution in the form of chemical runoff and that the pollution imposes a $4 cost on society for each gallon of good X produced. What is the optimal quantity of good X production? Does the market overproduce or underproduce? O...
Most questions answered within 3 hours.
-
Using C++ :
A Pascals triangle row is constructed by looking at the previous
row and...
asked 25 seconds from now -
With what speed will the fastest photoelectrons be emitted from
a surface whose threshold wavelength is...
asked 43 seconds from now -
The following slope distances and differences in elevations
between the tape ends were recorded for a...
asked 1 minute ago -
1. Assuming random walk markets and normally distributed
returns, if a one day VaR on an...
asked 10 minutes ago -
(a) With a variable life insurance policy, the rate of return on
the investment (the death...
asked 20 minutes ago -
By applying what you know about Grignard reagents and the
mechanism by which benzoic acid is...
asked 44 minutes ago -
For thermoplastics, explain the effects of increasing of each of
the following properties on a polymer’s...
asked 45 minutes ago -
Make a menu for the user to use in python 3 that can search and
replace...
asked 35 minutes ago -
1) An aqueous solution contains 0.280 M
NaHS and 0.128 M
H2S.
The pH of this...
asked 50 minutes ago -
Situational Leadership
is based on interplay of all of the following except:
The amount of guidance...
asked 51 minutes ago -
Consider the following problem: given n positive integers,
separate them into two groups such that adding...
asked 55 minutes ago -
Briefly discuss the following statements:
2.1 A partner never has the right to claim compensation for...
asked 57 minutes ago