A loan officer compares the interest rates for 48-month fixed-rate auto loans and 48-month variable-rate auto...
A loan officer compares the interest rates for 48-month fixed-rate auto loans and 48-month variable-rate auto loans. Two independent, random samples of auto loan rates are selected. A sample of eight 48-month fixed−rate auto loans had the following loan rates (all written as percentages): 8.75 7.63 7.26 9.43 7.86 7.20 8.09 8.60 while a sample of five 48−month variable−rate auto loans had loan rates as follows: 7.60 7.00 6.79 7.36 6.99
(a) Set up the null and alternative hypotheses needed to determine whether the mean rates for 48-month fixed-rate and variable-rate auto loans differ.
H0: µf − µv = versus Ha: µf − µv ≠
(b) Use the data analysis tool in Excel to test the hypotheses you set up in part a. Assuming that the normality and equal variances assumptions hold, use the Excel output and critical values to test these hypotheses by setting α equal to .10, .05, .01, and .001. How much evidence is there that the mean rates for 48−month fixed and variable−rate auto loans differ? (Round your answer to 3 decimal places.)
t = with 11 df Reject H0 at α = , but not at α =
(c) Use the p−value to test these hypotheses by setting α equal to .10, .05, .01, and .001. How much evidence is there that the mean rates for 48−month fixed− and variable−rate auto loans differ? (Round your answer to 4 decimal places.)
p−value = Reject H0 at α = but not at α =
(d) Use a hypothesis test to establish that the difference between the mean rates for fixed− and variable−rate 48−month auto loans exceeds .4. Use α equal to .05. (Round your t answer to 3 decimal places and other answers to 1 decimal place.)
H0: µf − µv versus Ha: µf − µv t = H0 with a = .05.
Homework Answers
Soln
Let us call For Fixed-rate auto Loans Group as f and Variable-rate auto Loans Group as v
a)
Null and Alternate Hypothesis
H0: µf − µv = 0
Ha: µf − µv <> 0
b)
Steps in Excel
- Import data in Excel
- Click on Data Tab and then on Data Analysis Tool
- Select data and put hypothesized value as 0
- Click OK
- Repeat above steps but change alpha values to get different value for different alpha
Excel Output
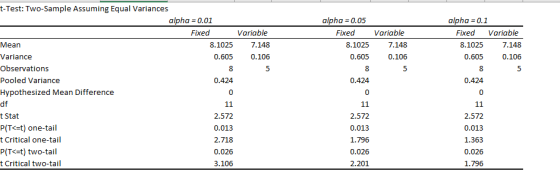
Result
Since for alpha = 0.01, the test statistic (2.572) is less than critical value (3.106), we fail to reject the null hypothesis
Hence we reject null hypothesis when alpha = 0.05 or 0.1 but not when alpha = 0.01
c)
Result
Since for alpha = 0.01, the p-value (0.026) is greater than 0.01, we fail to reject the null hypothesis
Hence we reject null hypothesis when alpha = 0.05 or 0.1 but not when alpha = 0.01
d)
Null and Alternate Hypothesis
H0: µf − µv = 0.4
Ha: µf − µv > 0.4
Test Statistic

t = 1.494
p-value = 0.082
Result and Conclusion
Since the p-value (0.082) is greater than 0.05, we fail to reject the null hypothesis
Add Answer to:
A loan officer compares the interest rates for 48-month
fixed-rate auto loans and 48-month variable-rate auto...
A loan officer compares the interest rates for 48-month fixed-rate auto loans and 48-month variable-rate auto...
A loan officer compares the interest rates for 48-month fixed-rate auto loans and 48-month variable-rate auto loans. Two independent, random samples of auto loan rates are selected. A sample of five 48-month variable-rate auto loans had the following loan rates: 2.10% 3.09% 2.873% 3.22% 3.11% while a sample of five 48-month fixed-rate auto loans had loan rates as follows: 4.030% 3.95% 4.390% 3.84% 4.23% Figure 11.7 JMP Output of Testing the Equality of Mean Loan Rates for Variable and Fixed...
A loan officer compares the interest rates for 48-month fixed-rate auto loans and 48-month variable-rate auto...
A loan officer compares the interest rates for 48-month fixed-rate auto loans and 48-month variable-rate auto loans. Two independent, random samples of auto loan rates are selected. A sample of eight 48-month fixed-rate auto loans and a sample of five variable-rate auto loans had the following loan rates: Fixed(%) Variable(%) 4.29 3.59 3.75 2.75 3.5 2.99 3.99 2.5 3.75 3 3.99 5.4 4 Answer the following questions:( I just need the numbers for the fill in the blanks, no need...
Not sure if any of the filled in answers are correct, so all would be appreciated....
 Not sure if any of the filled
in answers are correct, so all would be appreciated.
A loan officer compares the interest rates for 48-month fixed-rate auto loans and 48-month variable-rate auto loans. Two independent, random samples of aut rates are selected. A sample of eight 48-month fixed-rate auto loans had the following loan rates: 4.29% 3.75% 3.50% 3.99% 3.75% 3.99% 5.40% 4.00% 3.59% 2.75% 2.99% 2.50% 3.00% Figure 10.7 FIGURE 10.7 Excel Output of Testing the Equality of Mean...
Not sure if any of the filled
in answers are correct, so all would be appreciated.
A loan officer compares the interest rates for 48-month fixed-rate auto loans and 48-month variable-rate auto loans. Two independent, random samples of aut rates are selected. A sample of eight 48-month fixed-rate auto loans had the following loan rates: 4.29% 3.75% 3.50% 3.99% 3.75% 3.99% 5.40% 4.00% 3.59% 2.75% 2.99% 2.50% 3.00% Figure 10.7 FIGURE 10.7 Excel Output of Testing the Equality of Mean...
Recall that "very satisfied" customers give the XYZ-Box video game system a rating that is at...
Recall that "very satisfied" customers give the XYZ-Box video game system a rating that is at least 42. Suppose that the manufacturer of the XYZ-Box wishes to use the random sample of 70 satisfaction ratings to provide evidence supporting the claim that the mean composite satisfaction rating for the XYZ-Box exceeds 42. (a) Letting µ represent the mean composite satisfaction rating for the XYZ-Box, set up the null hypothesis H0 and the alternative hypothesis Ha needed if we wish to...
Suppose a sample of 49 paired differences that have been randomly selected from a normally distributed...
Suppose a sample of 49 paired differences that have been randomly selected from a normally distributed population of paired differences yields a sample mean d⎯⎯ =4.6d¯ =4.6 of and a sample standard deviation of sd = 7.6. (a) Calculate a 95 percent confidence interval for µd = µ1 – µ2. Can we be 95 percent confident that the difference between µ1 and µ2 is greater than 0? (Round your answers to 2 decimal places.) Confidence interval = [ , ] ;...
Suppose a sample of 49 paired differences that have been randomly selected from a normally distributed...
Suppose a sample of 49 paired differences that have been randomly selected from a normally distributed population of paired differences yields a sample mean d¯ =5.0d¯ =5.0 of and a sample standard deviation of sd = 7.8. (a) Calculate a 95 percent confidence interval for µd = µ1 – µ2. Can we be 95 percent confident that the difference between µ1 and µ2 is greater than 0? (Round your answers to 2 decimal places.) Confidence interval = [ , ] ;...
Suppose a sample of 49 paired differences that have been randomly selected from a normally distributed...
Suppose a sample of 49 paired differences that have been randomly selected from a normally distributed population of paired differences yields a sample mean d¯ =4.2 of and a sample standard deviation of sd = 7.6. (a) Calculate a 95 percent confidence interval for µd = µ1 – µ2. Can we be 95 percent confident that the difference between µ1 and µ2 is greater than 0? (Round your answers to 2 decimal places.) Confidence interval = [ ? , ?...
Suppose a sample of 49 paired differences that have been randomly selected from a normally distributed...
 Suppose a sample of 49 paired differences that have been randomly selected from a normally distributed population of paired differences yields a sample mean of d? 5 and a sample standard deviation of sd-7. (a) Calculate a 95 percent confidence interval for μο" μι-P2. (Round your answers to 2 decimal places.) Confidence interval 2.989 7011 (b) Test the null hypothesis Ho: μ.-0 versus the alternative hypothesis Ha: Ha ? 0 by setting ? equal to 10, 05, 01, and .001....
A mortgage specialist would like to analyze the average mortgage rates for Atlanta, Georgia. He collects...
A mortgage specialist would like to analyze the average mortgage rates for Atlanta, Georgia. He collects data on the annual percentage rates (APR in %) for 30-year fixed loans as shown in the following table. If he is willing to assume that these rates are randomly drawn from a normally distributed population, can he conclude that the mean mortgage rate for the population exceeds 4.20%? Test the hypothesis at a 10% level of significance. (You may find it useful to...
A mortgage specialist would like to analyze the average mortgage rates for Atlanta, Georgia. He collects...
A mortgage specialist would like to analyze the average mortgage rates for Atlanta, Georgia. He collects data on the annual percentage rates (APR in %) for 30-year fixed loans as shown in the following table. If he is willing to assume that these rates are randomly drawn from a normally distributed population, can he conclude that the mean mortgage rate for the population exceeds 4.45%? Test the hypothesis at a 1% level of significance. Financial Institution APR G Squared Financial...
 Not sure if any of the filled
in answers are correct, so all would be appreciated.
A loan officer compares the interest rates for 48-month fixed-rate auto loans and 48-month variable-rate auto loans. Two independent, random samples of aut rates are selected. A sample of eight 48-month fixed-rate auto loans had the following loan rates: 4.29% 3.75% 3.50% 3.99% 3.75% 3.99% 5.40% 4.00% 3.59% 2.75% 2.99% 2.50% 3.00% Figure 10.7 FIGURE 10.7 Excel Output of Testing the Equality of Mean...
Not sure if any of the filled
in answers are correct, so all would be appreciated.
A loan officer compares the interest rates for 48-month fixed-rate auto loans and 48-month variable-rate auto loans. Two independent, random samples of aut rates are selected. A sample of eight 48-month fixed-rate auto loans had the following loan rates: 4.29% 3.75% 3.50% 3.99% 3.75% 3.99% 5.40% 4.00% 3.59% 2.75% 2.99% 2.50% 3.00% Figure 10.7 FIGURE 10.7 Excel Output of Testing the Equality of Mean...
 Suppose a sample of 49 paired differences that have been randomly selected from a normally distributed population of paired differences yields a sample mean of d? 5 and a sample standard deviation of sd-7. (a) Calculate a 95 percent confidence interval for μο" μι-P2. (Round your answers to 2 decimal places.) Confidence interval 2.989 7011 (b) Test the null hypothesis Ho: μ.-0 versus the alternative hypothesis Ha: Ha ? 0 by setting ? equal to 10, 05, 01, and .001....
Most questions answered within 3 hours.
-
The labor force minus the number of employed equals the number
of unemployed.
a. True
b....
asked 1 hour ago -
Determine the mass in units of grams [g] of 0.49 moles [mol]
of a new fictitious...
asked 2 hours ago -
A horizontal mass of M=5kg is on a spring and stretched to
x=0.5m when released from...
asked 3 hours ago -
26 of 50
"I have worked at the Arizona Humane Society for ten years, and
have...
asked 3 hours ago -
Compare and contrast zero based budgeting and incremental (or
base year) budgeting.
asked 3 hours ago -
4 pts 10. Which of the following hypothesis would be MOST
difficult to test experimentally? Group...
asked 3 hours ago -
A business owner makes 1,000 items a day. Each day he or she
contributes eight hours...
asked 3 hours ago -
A
circular loop in the plane of a paper lies inca0.65 T magnetic
field pointing into...
asked 4 hours ago -
A business owner is trying to decide whether to buy, rent, or
lease office space and...
asked 4 hours ago -
Thermal Storage Solar heating of a house is much more efficient
if there is a way...
asked 4 hours ago -
Considering the “fits” for group and job design dimensions,
suppose you had 12 employees with different...
asked 4 hours ago -
Consider TCP connection management.
How many segments are typically involved in the TCP connection
establishment? What...
asked 4 hours ago