

Homework Answers
10. Here distribution is normal with mean=792 and standard deviation=103
Now we need to find x1 and x2 such that 
Using z table we get 
So we have 
So 
And 
Add Answer to:
please explain by steps! very confused
10) The average charitable contribution itemized per income tax return...
32) According to American Airlines, Flight 215 from Orlando to Los Angeles is on time 90%...
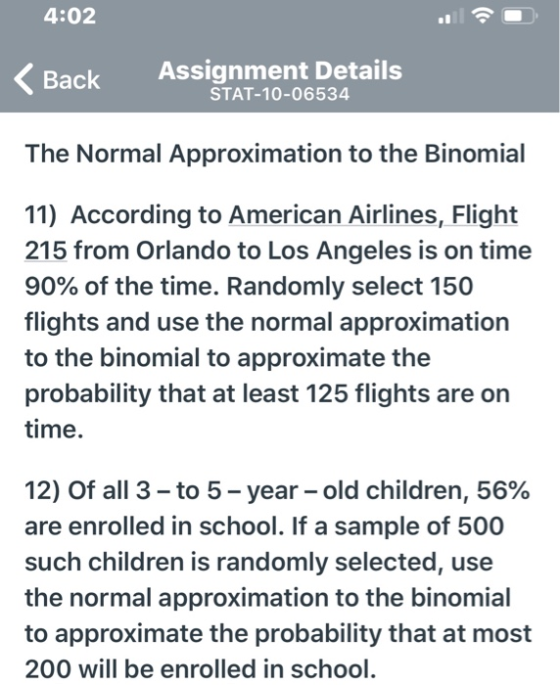
 32) According to American Airlines, Flight 215 from Orlando to Los Angeles is on time 90% of the time. Randomly select 150 flights and use the normal approximation to the binomial to approximate the probability that at least 125 flights are on time 33) of all 3-to 5-year-old children, 56% are enrolled in school. If a sample of 500 such children is randomly selected, use the normal approximation to the binomial to approximate the probability that at most 200 will...
According to a study, 47% of all males between the ages of 18 and 24 live...
According to a study, 47% of all males between the ages of 18 and 24 live at home. (Unmarried college students living in a dorm are counted as living at home.) Suppose that a survey is administered and 125 of 234 respondents indicated that they live at home. (a) Use the normal approximation to the binomial to approximate the probability that at least 125 respondents live at home. (b) Do the results from part (a) contradict the study?
According to a study, 75% of all males between the ages of 18 and 24 live...
According to a study, 75% of all males between the ages of 18 and 24 live at home. (Unmarried college students living in a dorm are counted as living at home.) Suppose that a survey is administered and 158 of 200 respondents indicated that they live at home. (a) Use the normal approximation to the binomial to approximate the probability that at least 158158 respondents live at home. (b) Do the results from part (a) contradict the study? (a)...
According to a study, 66% of all males between the ages of 18 and 24 live...
According to a study, 66% of all males between the ages of 18 and 24 live at home. (Unmarried college students living in a dorm are counted as living at home.) Suppose that a survey is administered and 140 of 207 respondents indicated that they live at home. (a) Use the normal approximation to the binomial to approximate the probability that at least 140 respondents live at home. (b) Do the results from part (a) contradict the study?
According to a study. 54% of all males between the ages of 18 and 24 live...
 According to a study. 54% of all males between the ages of 18 and 24 live at home U marred college students living in a dorm are couted as living at home Suppose that a survey is administered and 146 of 226 respondents indicated that they live at home. (a) Use the normal approximation to the binomial to approximate the probability that at least 146 respondents live at home. (b) Do the results from part (a) contradict the study? (a)...
According to a study, 69% o all males between the ages of 18 and 24 live...
 According to a study, 69% o all males between the ages of 18 and 24 live at home. Unmarried college st de sliving in a mare count a ving athome. Suppose that a survey is administered and 166 of 234 respondents indicated that they live at home. (a) Use the normal approximation to the binomial to approximate the probability that at least 166 respondents live at home? (b) Do the results from part (a) contradict the study? (a) P(X2 166)(Round...
6.143 Cigarette Smoke Exposure. Researchers G. Evans and E. Kantrowitz explored the health consequences for exposure...
 6.143 Cigarette Smoke Exposure. Researchers G. Evans and E. Kantrowitz explored the health consequences for exposure to many different environmental risks in the journal article "Socioe- conomic Status and Health: The Potential Role of Environmental Risk Exposure" (Annual Review of Public Health, Vol. 23, No. 1, pp. 303-331). According to research. 65% of preschool children living in poverty have been exposed to cigarette smoke at home. In comparison, 45% of preschool children not in poverty have been exposed to cigarette...
25) Is it parameter or statistic? Please, explain why. a high school degree; high school degree;...
 25) Is it parameter or statistic? Please, explain why.
a high school degree; high school degree; more than high school degree. 24) A researcher wants to investigate a correlation between meth use as a teen, and having marital problems as an adult a) Identify the population b) What are the two groups that are being compared? c) What is the explanatory variable? What is the response? d) Find a confounding variable. e) Which type of study is more appropriate: observational...
25) Is it parameter or statistic? Please, explain why.
a high school degree; high school degree; more than high school degree. 24) A researcher wants to investigate a correlation between meth use as a teen, and having marital problems as an adult a) Identify the population b) What are the two groups that are being compared? c) What is the explanatory variable? What is the response? d) Find a confounding variable. e) Which type of study is more appropriate: observational...
According to a polling organization, 21% of adults in a large region consider themselves to be...
 According to a polling organization, 21% of adults in a large region consider themselves to be liberal. A survey asked 200 respondents to disclose their political philosophy: Conservative, Liberal, Moderate. Treat the results of the survey as a random sample of adults in this region. Do the survey results suggest the proportion is higher than that reported by the polling organization? Use an a=0.05 level of significance. Click the icon to view the survey results. the requirements for Because np....
Using the answers from the table above, answer ALL of the questions below. For questions 1 - 13, draw a normal curve and indicate the area that you are calculating the probability of. For questions...
 Using the answers from the table above, answer ALL of
the questions below. For questions 1 - 13, draw a
normal curve and indicate the area that you are calculating the
probability of. For questions 14 – 22, use the
appropriate formulas and show all of your
calculations.
Be sure to turn in the table above along with your
answers to all of the questions below. Place your answers in a
folder with your name clearly written at the top...
Using the answers from the table above, answer ALL of
the questions below. For questions 1 - 13, draw a
normal curve and indicate the area that you are calculating the
probability of. For questions 14 – 22, use the
appropriate formulas and show all of your
calculations.
Be sure to turn in the table above along with your
answers to all of the questions below. Place your answers in a
folder with your name clearly written at the top...
 32) According to American Airlines, Flight 215 from Orlando to Los Angeles is on time 90% of the time. Randomly select 150 flights and use the normal approximation to the binomial to approximate the probability that at least 125 flights are on time 33) of all 3-to 5-year-old children, 56% are enrolled in school. If a sample of 500 such children is randomly selected, use the normal approximation to the binomial to approximate the probability that at most 200 will...
 According to a study. 54% of all males between the ages of 18 and 24 live at home U marred college students living in a dorm are couted as living at home Suppose that a survey is administered and 146 of 226 respondents indicated that they live at home. (a) Use the normal approximation to the binomial to approximate the probability that at least 146 respondents live at home. (b) Do the results from part (a) contradict the study? (a)...
 According to a study, 69% o all males between the ages of 18 and 24 live at home. Unmarried college st de sliving in a mare count a ving athome. Suppose that a survey is administered and 166 of 234 respondents indicated that they live at home. (a) Use the normal approximation to the binomial to approximate the probability that at least 166 respondents live at home? (b) Do the results from part (a) contradict the study? (a) P(X2 166)(Round...
 6.143 Cigarette Smoke Exposure. Researchers G. Evans and E. Kantrowitz explored the health consequences for exposure to many different environmental risks in the journal article "Socioe- conomic Status and Health: The Potential Role of Environmental Risk Exposure" (Annual Review of Public Health, Vol. 23, No. 1, pp. 303-331). According to research. 65% of preschool children living in poverty have been exposed to cigarette smoke at home. In comparison, 45% of preschool children not in poverty have been exposed to cigarette...
 25) Is it parameter or statistic? Please, explain why.
a high school degree; high school degree; more than high school degree. 24) A researcher wants to investigate a correlation between meth use as a teen, and having marital problems as an adult a) Identify the population b) What are the two groups that are being compared? c) What is the explanatory variable? What is the response? d) Find a confounding variable. e) Which type of study is more appropriate: observational...
25) Is it parameter or statistic? Please, explain why.
a high school degree; high school degree; more than high school degree. 24) A researcher wants to investigate a correlation between meth use as a teen, and having marital problems as an adult a) Identify the population b) What are the two groups that are being compared? c) What is the explanatory variable? What is the response? d) Find a confounding variable. e) Which type of study is more appropriate: observational...
 According to a polling organization, 21% of adults in a large region consider themselves to be liberal. A survey asked 200 respondents to disclose their political philosophy: Conservative, Liberal, Moderate. Treat the results of the survey as a random sample of adults in this region. Do the survey results suggest the proportion is higher than that reported by the polling organization? Use an a=0.05 level of significance. Click the icon to view the survey results. the requirements for Because np....
 Using the answers from the table above, answer ALL of
the questions below. For questions 1 - 13, draw a
normal curve and indicate the area that you are calculating the
probability of. For questions 14 – 22, use the
appropriate formulas and show all of your
calculations.
Be sure to turn in the table above along with your
answers to all of the questions below. Place your answers in a
folder with your name clearly written at the top...
Using the answers from the table above, answer ALL of
the questions below. For questions 1 - 13, draw a
normal curve and indicate the area that you are calculating the
probability of. For questions 14 – 22, use the
appropriate formulas and show all of your
calculations.
Be sure to turn in the table above along with your
answers to all of the questions below. Place your answers in a
folder with your name clearly written at the top...
Most questions answered within 3 hours.
-
You and your opponent both roll a fair die. If you both roll the
same number,...
asked 6 minutes ago -
In a study of the accuracy of fast food drive-through orders,
Restaurant A had 257 accurate...
asked 5 minutes ago -
Identify and describe in detail the four categories of
institutions that could be included in a...
asked 11 minutes ago -
In python
class Customer:
def __init__(self, customer_id, last_name, first_name, phone_number, address):
self._customer_id = int(customer_id)
self._last_name =...
asked 19 minutes ago -
What is an example of a limitation in implementing a new
ERP system and how it...
asked 14 minutes ago -
In a section of 9.7cm of an artery with a radius of 2.6mm there
is a...
asked 15 minutes ago -
the two carboxylic acid groups of aspartic acid have different
acidities with pKa values of 2.1...
asked 19 minutes ago -
Would CuCO3 aqueous salt combined with calcium chloride
form a solid precipitate? If so, what would...
asked 18 minutes ago -
How do ECM Solutions assist in embedding a culture of continuous
improvement in an organization? (Project...
asked 38 minutes ago -
Directions
These directions introduce the idea of Essential Questions.
Since this may be a new concept...
asked 40 minutes ago -
1.b. Fiscal policy is said to suffer from ‘crowding out’.
Explain what this means and why...
asked 58 minutes ago -
The equation for the reaction of nitrogen and oxygen to form
nitrogen oxide is written as...
asked 1 hour ago