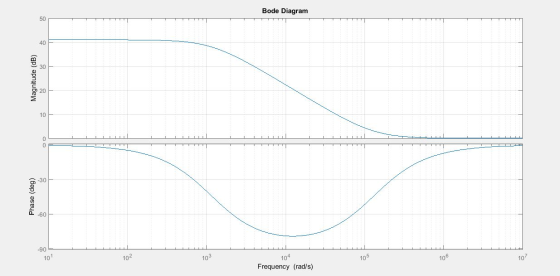
- See Figure 1391
- R=81.3 Ohms
- C=10.5 uF
- R_ESR=0.733 Ohms
- Make a MATLAB Bode plot of the TF

Homework Answers

matlab code:
>> a=[1 129929.18];
b=[1 1160.973];
H=tf(a,b)
bode(H)
grid on
H =
s + 1.299e05
------------
s + 1161
Continuous-time transfer function.
bode plot:
Add Answer to:
See Figure 1391
R=81.3 Ohms
C=10.5 uF
R_ESR=0.733 Ohms
Make a MATLAB Bode plot of the...
Make a Bode plot for the filter in the figure below for three decades of frequency....
 Make a Bode plot for the filter in the figure below for three decades of frequency. Use similog graph paper -o V out 4.7 mH R 2.2 ΚΩ
IV) Shown below in figure A is a feedback circuit and the Bode plot for Ael....
 IV) Shown below in figure A is a feedback circuit and the Bode plot for Ael. In figure B a pole has been added to the circuit to make it stable with a 45° phase margin. A) For figure A draw the Bode plot of Aol (as given) and the loop gain on the same plot. B) FIND RFOR 45' PHASE MARGIN É DRAW THE LOOP SAIN C) What is the closed loop gain at DC. NIN lou HT 0.1...
Assume that the transistor parameters are those for the 2N7000 NMOS transistors in your parts kit. That is: VTN = 2 V, KN = 0.05 A/V2 Draw the bode magnitude and bode phase plot See Figure 2. Assume...
 Assume that the transistor parameters are those for the 2N7000
NMOS transistors in your parts kit. That is: VTN = 2 V, KN = 0.05
A/V2
Draw the bode magnitude and bode phase plot
See Figure 2. Assume that the transistor is biased in the forward active region of operation and: V. BIAS Rs DR OUT Vsensoro BIAS Figure 2
See Figure 2. Assume that the transistor is biased in the forward active region of operation and: V. BIAS Rs...
Assume that the transistor parameters are those for the 2N7000
NMOS transistors in your parts kit. That is: VTN = 2 V, KN = 0.05
A/V2
Draw the bode magnitude and bode phase plot
See Figure 2. Assume that the transistor is biased in the forward active region of operation and: V. BIAS Rs DR OUT Vsensoro BIAS Figure 2
See Figure 2. Assume that the transistor is biased in the forward active region of operation and: V. BIAS Rs...
Use MATLAB to write a function that takes inputs R, L, C, TO, Tf, DeltaT and...
 Use MATLAB to write a function that takes inputs R, L, C, TO, Tf, DeltaT and f and produces as output the charge on the capacitor in a driven RLC series circuit where the input voltage source is v(t) = cos(21 ft). Here f is the frequency of the voltage source in Hz. This function returns the inverse Laplace Transform of (1) L (s2 + 2) ($2 + 2as +B) where a = # and B = Lc. Note that...
For the unity feedback system in the below figure, 1. EGO) R(s)) C(s) G(s)K (s 1) (s + 4) a) Sket...
 For the unity feedback system in the below figure, 1. EGO) R(s)) C(s) G(s)K (s 1) (s + 4) a) Sketch the bode plot with Matlab command bode0 b) Plot the nyquist diagram using Matlab command nyquist(0, find the system stability c) Find phase margin, gain margin, and crossover frequencies using Matlab command margin(0 and find the system stability
For the unity feedback system in the below figure, 1. EGO) R(s)) C(s) G(s)K (s 1) (s + 4) a) Sketch...
For the unity feedback system in the below figure, 1. EGO) R(s)) C(s) G(s)K (s 1) (s + 4) a) Sketch the bode plot with Matlab command bode0 b) Plot the nyquist diagram using Matlab command nyquist(0, find the system stability c) Find phase margin, gain margin, and crossover frequencies using Matlab command margin(0 and find the system stability
For the unity feedback system in the below figure, 1. EGO) R(s)) C(s) G(s)K (s 1) (s + 4) a) Sketch...
Input voltage is applied to a circuit consisting of a series connection of capacitor C=10 uF...
 Input voltage is applied to a circuit consisting of a series connection of capacitor C=10 uF ("u"="micro") and resistor R=60 Ohm. The output voltage is the voltage across resistor R. Find the corner frequency omc of the circuit in rad/s (do not enter the units). Submit Answer Tries 0/3 Using the graph windows below, generate Bode plots for the magnitude and phase of the transfer function H in the com/omc) range from 0.01 to 100- The horizontal axis (omega-axis) has...
1. A resistor R = 586 k(ohms) and a capacitor C= 87.4 uF are connected in...
1. A resistor R = 586 k(ohms) and a capacitor C= 87.4 uF are connected in series with a 9V battery. At t = 0 a switch is closed and the capacitor is allowed to charge. a) What is the initial current in the circuit? b) What is the initial charge on the capacitor? c) What is the time constant? d) What is the current after 1.84s has passed? e) At what time is the charge on the capacitor equal...
Consider the filter circuit (Figure 1) with R=500 N and C ==uF. Learning Goal: To understand...
 Consider the filter circuit (Figure 1) with R=500 N and C ==uF. Learning Goal: To understand how to find the transfer function of a filter circuit and to be able to draw the asymptotes of the Bode magnitude and phase diagrams Bode plots are used to display the amplitude and phase of a transfer function. The amplitude is typically displayed by showing the magnitude of the transfer function on the vertical axis and the frequency on the horizontal axis using...
Required: MATLAB CODE and attached figure window for the this question. 12. Make the plot of the astroid that is shown...
 Required: MATLAB CODE and attached figure window for the this
question.
12. Make the plot of the astroid that is shown in the is problem by using the parametric equa- 0.5 tion: 05 0s cos'() and y -sin'(t) for -x<T
12. Make the plot of the astroid that is shown in the is problem by using the parametric equa- 0.5 tion: 05 0s cos'() and y -sin'(t) for -x
Required: MATLAB CODE and attached figure window for the this
question.
12. Make the plot of the astroid that is shown in the is problem by using the parametric equa- 0.5 tion: 05 0s cos'() and y -sin'(t) for -x<T
12. Make the plot of the astroid that is shown in the is problem by using the parametric equa- 0.5 tion: 05 0s cos'() and y -sin'(t) for -x
R1=1e3; C=10e-6; % R=1K ohms, C=1 uF num = -1; den = [R1*C 1]; T=[0:.001:5]; W=...
R1=1e3; C=10e-6; % R=1K ohms, C=1 uF num = -1; den = [R1*C 1]; T=[0:.001:5]; W= logspace(1,3,20) for i= 1:length(W) w=W(i); u=cos(w*T); y=lsim(H1,u,T); gain(i)=max(y)/max(u); plot(T,u,T,y), grid, title(['x(t) & y(t): w = ' num2str(w)]) shg pause end semilogx(W,20*log10(gain)),grid, title('Frequency Response gain H1(w)'); xlabel(‘Freq (r/s)’) ylabel(‘db(H1)’) shg How can this code sweep a sine wave? And measure dB to get a frequency response
 Make a Bode plot for the filter in the figure below for three decades of frequency. Use similog graph paper -o V out 4.7 mH R 2.2 ΚΩ
 IV) Shown below in figure A is a feedback circuit and the Bode plot for Ael. In figure B a pole has been added to the circuit to make it stable with a 45° phase margin. A) For figure A draw the Bode plot of Aol (as given) and the loop gain on the same plot. B) FIND RFOR 45' PHASE MARGIN É DRAW THE LOOP SAIN C) What is the closed loop gain at DC. NIN lou HT 0.1...
 Assume that the transistor parameters are those for the 2N7000
NMOS transistors in your parts kit. That is: VTN = 2 V, KN = 0.05
A/V2
Draw the bode magnitude and bode phase plot
See Figure 2. Assume that the transistor is biased in the forward active region of operation and: V. BIAS Rs DR OUT Vsensoro BIAS Figure 2
See Figure 2. Assume that the transistor is biased in the forward active region of operation and: V. BIAS Rs...
Assume that the transistor parameters are those for the 2N7000
NMOS transistors in your parts kit. That is: VTN = 2 V, KN = 0.05
A/V2
Draw the bode magnitude and bode phase plot
See Figure 2. Assume that the transistor is biased in the forward active region of operation and: V. BIAS Rs DR OUT Vsensoro BIAS Figure 2
See Figure 2. Assume that the transistor is biased in the forward active region of operation and: V. BIAS Rs...
 Use MATLAB to write a function that takes inputs R, L, C, TO, Tf, DeltaT and f and produces as output the charge on the capacitor in a driven RLC series circuit where the input voltage source is v(t) = cos(21 ft). Here f is the frequency of the voltage source in Hz. This function returns the inverse Laplace Transform of (1) L (s2 + 2) ($2 + 2as +B) where a = # and B = Lc. Note that...
 For the unity feedback system in the below figure, 1. EGO) R(s)) C(s) G(s)K (s 1) (s + 4) a) Sketch the bode plot with Matlab command bode0 b) Plot the nyquist diagram using Matlab command nyquist(0, find the system stability c) Find phase margin, gain margin, and crossover frequencies using Matlab command margin(0 and find the system stability
For the unity feedback system in the below figure, 1. EGO) R(s)) C(s) G(s)K (s 1) (s + 4) a) Sketch...
For the unity feedback system in the below figure, 1. EGO) R(s)) C(s) G(s)K (s 1) (s + 4) a) Sketch the bode plot with Matlab command bode0 b) Plot the nyquist diagram using Matlab command nyquist(0, find the system stability c) Find phase margin, gain margin, and crossover frequencies using Matlab command margin(0 and find the system stability
For the unity feedback system in the below figure, 1. EGO) R(s)) C(s) G(s)K (s 1) (s + 4) a) Sketch...
 Input voltage is applied to a circuit consisting of a series connection of capacitor C=10 uF ("u"="micro") and resistor R=60 Ohm. The output voltage is the voltage across resistor R. Find the corner frequency omc of the circuit in rad/s (do not enter the units). Submit Answer Tries 0/3 Using the graph windows below, generate Bode plots for the magnitude and phase of the transfer function H in the com/omc) range from 0.01 to 100- The horizontal axis (omega-axis) has...
 Consider the filter circuit (Figure 1) with R=500 N and C ==uF. Learning Goal: To understand how to find the transfer function of a filter circuit and to be able to draw the asymptotes of the Bode magnitude and phase diagrams Bode plots are used to display the amplitude and phase of a transfer function. The amplitude is typically displayed by showing the magnitude of the transfer function on the vertical axis and the frequency on the horizontal axis using...
 Required: MATLAB CODE and attached figure window for the this
question.
12. Make the plot of the astroid that is shown in the is problem by using the parametric equa- 0.5 tion: 05 0s cos'() and y -sin'(t) for -x<T
12. Make the plot of the astroid that is shown in the is problem by using the parametric equa- 0.5 tion: 05 0s cos'() and y -sin'(t) for -x
Required: MATLAB CODE and attached figure window for the this
question.
12. Make the plot of the astroid that is shown in the is problem by using the parametric equa- 0.5 tion: 05 0s cos'() and y -sin'(t) for -x<T
12. Make the plot of the astroid that is shown in the is problem by using the parametric equa- 0.5 tion: 05 0s cos'() and y -sin'(t) for -x
Most questions answered within 3 hours.
-
What are the variety of forms of products dispensed with aerosol
spray?
asked 1 minute ago -
Which one of the following statements is true about C++
keywords?
a. A keyword can have...
asked 1 minute ago -
Pyruvate Kinase, an allosteric enzyme, accelerates the
conversion of phosphoenolpyruvate to pyruvate.
1) Draw curves describing...
asked 3 minutes ago -
question 1
Which of the following is an example of a bottom-up technique
for developing promotional...
asked 21 minutes ago -
1)In FM modulation, what aspect of the carrier is being
modulated?
2)Explain in your own words,...
asked 17 minutes ago -
Andromeda Galaxy, M31, is considered a sister galaxy to Milky
Way galaxy. One similarirty is their...
asked 23 minutes ago -
How does temperature affect ADH during enzyme
kinetics?
asked 31 minutes ago -
A $1000 par value convertible bond has a conversion price of
$25. It is currently selling...
asked 39 minutes ago -
Write a java program that declares 10 element array (of type
integers), creates and initializes the...
asked 37 minutes ago -
import java.util.Arrays;
import java.util.Random;
import java.util.Scanner;
/**
* TODO Write a summary of the role of...
asked 42 minutes ago -
Sodium hydroxide is a strong base and ammonium hydroxide is a
weak base. Which of the...
asked 47 minutes ago -
Glycerol, C3H8O3, is a substance used extensively in the
manufacture of cosmetics, foodstuffs, antifreeze, and plastics....
asked 50 minutes ago