A sample of n = 4 scores was collected from a population with unknown parameters. Scores:...
A sample of n = 4 scores was collected from a population with unknown parameters.
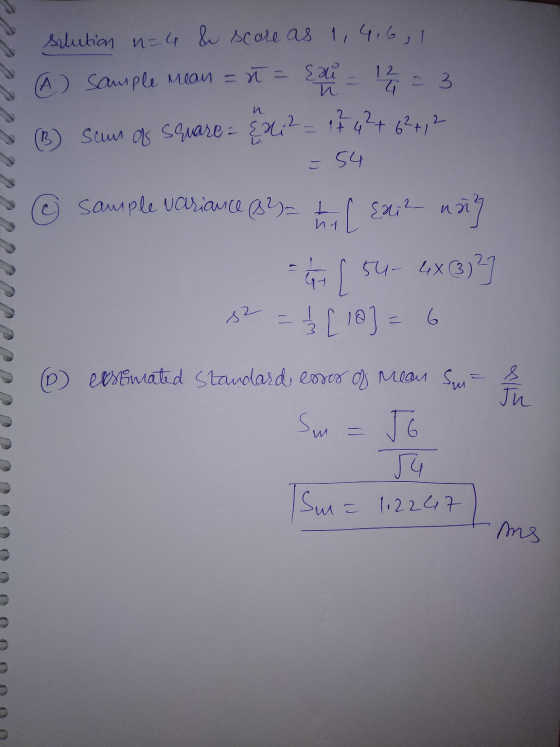
Scores: 1, 4, 6, 1.
A. What is the mean of the sample?
B. What is the sum of squares, SS?
C. What is the sample variance, s2?
D. What is the estimated standard error of the mean, sM?
Homework Answers
Add Answer to:
A sample of n = 4 scores was collected from a population with
unknown parameters.
Scores:...
The following sample of n = 4 scores was obtained from a population with unknown parameters....
 The following sample of n = 4 scores was obtained from a population with unknown parameters. Scores: 2, 2, 6, 2 Compute the sample mean and standard deviation. Note: These are descriptive values that summarize the sample data. (Round your answers to two decimal places.) M = S = Compute the estimated standard error for M. (Note: This is an inferential value that describes how accurately the sample mean represents the unknown population mean.) SM =
Question 6 5 pts A sample of n = 4 scores with SS = 48 has...
 Question 6 5 pts A sample of n = 4 scores with SS = 48 has a variance of s = 16 and an estimated standard error of 2. True O False
19. A repeated-measures study comparing two treatments with a sample of n 10 participants produces a...
 19. A repeated-measures study comparing two treatments with a sample of n 10 participants produces a mean of M 8 for the scores in the first treatment, a mean of M 10 for the scores in the second treatment, and a mean of MD 2 with Sum of squares of the difference SS 64 for the difference scores. What is the estimated standard error for the sample mean difference? Answer:
25 Anormal population - 0 - 8. A random sample and scores from 54 Wurthe-wore for...
 25 Anormal population - 0 - 8. A random sample and scores from 54 Wurthe-wore for this sample is population has a mean of 24. A random sample of 4 scares is obtained from a mal population with probability of obtaining met greater than 22 for this sample! - 20 and a t West - 20 the following samples is deur likely to be obtained For normal perelation with a Band for a sample of n = 4 X- 5...
A population of N = 10 scores has a mean of μ = 24 with SS...
A population of N = 10 scores has a mean of μ = 24 with SS = 160, a variance of σ2 = 16, and a standard deviation of σ = 4. For this population, what is Σ(X − μ)? A. 0. B. 4. C. 16. D. 160
Consider the data in the table collected from three independent populations. Sample 1 Sample 2 Sample...
 Consider the data in the table collected from three independent populations. Sample 1 Sample 2 Sample 3 a) Calculate the total sum of squares (SST) and partition the SST into its two components, the sum of squares between (SSB) and the sum of squares within (SS) b) Use these values to construct a one-way ANOVA table c) using α-0.05, what conclusions can be made concerning the population means? 14 Click the lcon to view a table of critical F-scores for...
Consider the data in the table collected from four independent populations. Sample Sample Sample Sample 1...
 Consider the data in the table collected from four independent populations. Sample Sample Sample Sample 1 2 4 17 16 10 4 11 20 5 a) Calculate the total sum of squares (SST). b) Partition the SST into its two components, the sum of squares between (SSB) and the sum of squares within (SSW) c) Using a 0.05, what conclusions can be made concerning the population means? 14 23 3 9 Click the icon to view a table of critical...
Let yı, y2,-. ., yn be a sample drawn from a normal population with unknown mean...
 Let yı, y2,-. ., yn be a sample drawn from a normal population with unknown mean μ an model d unknown variance σ2. One way to estimate μ is to fit the linear (2.61) and use the least squares (LS), that is, to minimize the sum of squares, Σ (Vi-A)2. Another way is to use the least absolute value (L AV), that is, to minimize the sum of absolute value of the vertical distances, Σ bi-μ| (a) Show that the...
How do you find standard deviation once you know variance? a. take the square root of...
How do you find standard deviation once you know variance? a. take the square root of variance b. square variance c. they are the same d.Variance minus 1 equals standard deviation This is the equation for population variance ______ a. Sum of Squares divided by N SS/N b. Sum of Squares divided by N plus one SS/N+1 c. Sum of Squares divided by N minus one SS/N-1 d. It is the same for sample variance You would use this equation...
Please help me with all 4. 3. Below you are provided with the sum of squares,...
 Please help me with all 4.
3. Below you are provided with the sum of squares, the variance, or the standard deviation for a sample, as well as the sample size. Given a value, provide values for the other measures. For example, if the standard deviation is provided, then you will have to work backwards” to calculate the variance, then the sum of squares. (2 pts total). A. SS = 2500 B. SS = S2 = S2 = S =...
Please help me with all 4.
3. Below you are provided with the sum of squares, the variance, or the standard deviation for a sample, as well as the sample size. Given a value, provide values for the other measures. For example, if the standard deviation is provided, then you will have to work backwards” to calculate the variance, then the sum of squares. (2 pts total). A. SS = 2500 B. SS = S2 = S2 = S =...
 The following sample of n = 4 scores was obtained from a population with unknown parameters. Scores: 2, 2, 6, 2 Compute the sample mean and standard deviation. Note: These are descriptive values that summarize the sample data. (Round your answers to two decimal places.) M = S = Compute the estimated standard error for M. (Note: This is an inferential value that describes how accurately the sample mean represents the unknown population mean.) SM =
 Question 6 5 pts A sample of n = 4 scores with SS = 48 has a variance of s = 16 and an estimated standard error of 2. True O False
 19. A repeated-measures study comparing two treatments with a sample of n 10 participants produces a mean of M 8 for the scores in the first treatment, a mean of M 10 for the scores in the second treatment, and a mean of MD 2 with Sum of squares of the difference SS 64 for the difference scores. What is the estimated standard error for the sample mean difference? Answer:
 25 Anormal population - 0 - 8. A random sample and scores from 54 Wurthe-wore for this sample is population has a mean of 24. A random sample of 4 scares is obtained from a mal population with probability of obtaining met greater than 22 for this sample! - 20 and a t West - 20 the following samples is deur likely to be obtained For normal perelation with a Band for a sample of n = 4 X- 5...
 Consider the data in the table collected from three independent populations. Sample 1 Sample 2 Sample 3 a) Calculate the total sum of squares (SST) and partition the SST into its two components, the sum of squares between (SSB) and the sum of squares within (SS) b) Use these values to construct a one-way ANOVA table c) using α-0.05, what conclusions can be made concerning the population means? 14 Click the lcon to view a table of critical F-scores for...
 Consider the data in the table collected from four independent populations. Sample Sample Sample Sample 1 2 4 17 16 10 4 11 20 5 a) Calculate the total sum of squares (SST). b) Partition the SST into its two components, the sum of squares between (SSB) and the sum of squares within (SSW) c) Using a 0.05, what conclusions can be made concerning the population means? 14 23 3 9 Click the icon to view a table of critical...
 Let yı, y2,-. ., yn be a sample drawn from a normal population with unknown mean μ an model d unknown variance σ2. One way to estimate μ is to fit the linear (2.61) and use the least squares (LS), that is, to minimize the sum of squares, Σ (Vi-A)2. Another way is to use the least absolute value (L AV), that is, to minimize the sum of absolute value of the vertical distances, Σ bi-μ| (a) Show that the...
 Please help me with all 4.
3. Below you are provided with the sum of squares, the variance, or the standard deviation for a sample, as well as the sample size. Given a value, provide values for the other measures. For example, if the standard deviation is provided, then you will have to work backwards” to calculate the variance, then the sum of squares. (2 pts total). A. SS = 2500 B. SS = S2 = S2 = S =...
Please help me with all 4.
3. Below you are provided with the sum of squares, the variance, or the standard deviation for a sample, as well as the sample size. Given a value, provide values for the other measures. For example, if the standard deviation is provided, then you will have to work backwards” to calculate the variance, then the sum of squares. (2 pts total). A. SS = 2500 B. SS = S2 = S2 = S =...
Most questions answered within 3 hours.
-
Using MARS simulator, write MIPS programs according to
the following scenarios: Receive a positive integer number...
asked 1 hour ago -
An object in front of a concave mirror has a real image that is
11.5 cm...
asked 1 hour ago -
Consider the reaction, C3 H8 + O2 --> CO2 + H2O. How many
moles of O2...
asked 3 hours ago -
You and your opponent both roll a fair die. If you both roll the
same number,...
asked 3 hours ago -
In a study of the accuracy of fast food drive-through orders,
Restaurant A had 257 accurate...
asked 3 hours ago -
Identify and describe in detail the four categories of
institutions that could be included in a...
asked 3 hours ago -
In python
class Customer:
def __init__(self, customer_id, last_name, first_name, phone_number, address):
self._customer_id = int(customer_id)
self._last_name =...
asked 3 hours ago -
What is an example of a limitation in implementing a new
ERP system and how it...
asked 3 hours ago -
In a section of 9.7cm of an artery with a radius of 2.6mm there
is a...
asked 3 hours ago -
the two carboxylic acid groups of aspartic acid have different
acidities with pKa values of 2.1...
asked 3 hours ago -
Would CuCO3 aqueous salt combined with calcium chloride
form a solid precipitate? If so, what would...
asked 3 hours ago -
How do ECM Solutions assist in embedding a culture of continuous
improvement in an organization? (Project...
asked 4 hours ago