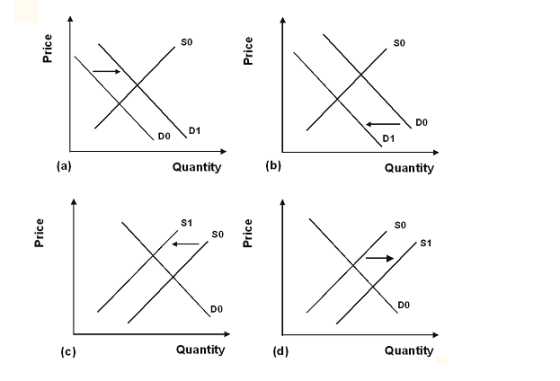
Suppose the graphs represent a labor market, where price is the wage rate. Which graph best shows the impact of a technological change that makes those workers unnecessary for production?
Homework Answers
Answer
Option graph b
==
The technological change decreases the demand for workers and the dee curve shifts to the left which decreases both wage and employment in the new equilibrium.
Demand increases when there is an increase in labor demand
Supply changes when labor preference or a number of labor and so changes.
Add Answer to:
Suppose the graphs represent a labor market, where price is the
wage rate. Which graph best...
Suppose the graph represents the labor market. Lineshows the relationship between the wage and the n...
 Suppose the graph represents the labor market. Lineshows the relationship between the wage and the n f people willing to work. Line the re ip between the wage and the A f shows people firms wish to hire. Quantity (workers) The demand curve for labor exhibits relationship between wage and quantity of workers a direct or positive demanded, and the supply curve of le relationship between wage and the quantity of an inverse people willing to work. an inverse or...
4. Minimum wage legislation The following graph shows the labor market in the fast-food industry in...
 4. Minimum wage legislation The following graph shows the labor market in the fast-food industry in the fictional town of Supersize City. Use the graph input tool to help you answer the following questions. You will not be graded on any changes you make to this graph. Note: Once you enter a value in a white field, the graph and any corresponding amounts in each grey field will change accordingly. In this market, the equilibrium hourly wage is and the equilibrium quantity of laboris...
4. Minimum wage legislation The following graph shows the labor market in the fast-food industry in...
 4. Minimum wage legislation The following graph shows the labor market in the fast-food industry in the fictional town of Supersize City. tool to help you answer the following questions. You will not be graded on any changes you make to this graph. Note: Once you enter a value in a white field, the graph and any corresponding amounts in each grey field will change accordingly. Graph Input Tool Market for Labor in the Fast Food Industry 20 18 16...
4. Minimum wage legislation The following graph shows the labor market in the fast-food industry in...
 4. Minimum wage legislation The following graph shows the labor market in the fast-food industry in the fictional town of Supersize City Use the graph input tool to help you answer the fallowing questions. You will not be graded on any changes you make to this graph Note: Once you entera value in a white field, the graph and any corresponding amounts in each grey ficld w change accordingly. Graph Input Tool Market for Labor in the Fast Food Industry...
4. Minimum wage legislation The following graph shows the labor market in the fast-food industry in...
 4. Minimum wage legislation The following graph shows the labor market in the fast-food industry in the fictional town of Supersize City. Use the graph input tool to help you answer the following questions. You will not be graded on any changes you make to this graph. Note: Once you enter a value in a white field, the graph and any corresponding amounts in each grey field will change accordingly. Graph Input Tool Market for Labor in the Fast Food...
4. Minimum wage legislation The following graph shows the labor market in the fast-food industry in...
 4. Minimum wage legislation The following graph shows the labor market in the fast-food industry in the fictional town of Supersize City. Use the graph input tool to help you answer the following questions. You will not be graded on any changes you make to this graph. Note: Once you enter a value in a white field, the graph and any corresponding amounts in each grey field will change accordingly. In this market, the equilibrium hourly wage is _______ , and the equilibrium...
4. Minimum wage legisiation The following graph shows the labor market in the fast-food industry in...
 4. Minimum wage legisiation The following graph shows the labor market in the fast-food industry in the fictional town of Supersize aty. Use the graph input tool to help you answer the folowing questions You will not be gradest on aty changes you make to ths graph aph and any corresponding amounts in each grey field wil change accordinghy Note: Once you enter a value in a white field, the g Graph Input Tool Market for Labor in the Fast...
The following graph shows the labor market in the fast-foodindustry in the fictional town of...
 The following graph shows the labor market in the fast-food
industry in the fictional town of Supersize City.Use the graph input tool to help you answer the following
questions. You will not be graded on any changes you make to this
graph.Note: Once you enter a value in a white field, the graph and any
corresponding amounts in each grey field will change
accordingly.In this market, the equilibrium hourly wage is___, and the
equilibrium quantity of labor is___ thousand workers.Suppose...
The following graph shows the labor market in the fast-food
industry in the fictional town of Supersize City.Use the graph input tool to help you answer the following
questions. You will not be graded on any changes you make to this
graph.Note: Once you enter a value in a white field, the graph and any
corresponding amounts in each grey field will change
accordingly.In this market, the equilibrium hourly wage is___, and the
equilibrium quantity of labor is___ thousand workers.Suppose...
The following graph shows the labor market in the fast-food industry in the fictional town of...
 The following graph shows the labor market in the fast-food industry in the fictional town of Supersize City. Use the graph input tool to help you answer the following questions. You will not be graded on any changes you make to this graph. Note: Once you enter a value in a white field, the graph and any corresponding amounts in each grey field will change accordingly. Graph Input Tool Market for Labor in the Fast Food Industry Wage (Dollars per...
 Suppose the graph represents the labor market. Lineshows the relationship between the wage and the n f people willing to work. Line the re ip between the wage and the A f shows people firms wish to hire. Quantity (workers) The demand curve for labor exhibits relationship between wage and quantity of workers a direct or positive demanded, and the supply curve of le relationship between wage and the quantity of an inverse people willing to work. an inverse or...
 4. Minimum wage legislation The following graph shows the labor market in the fast-food industry in the fictional town of Supersize City. tool to help you answer the following questions. You will not be graded on any changes you make to this graph. Note: Once you enter a value in a white field, the graph and any corresponding amounts in each grey field will change accordingly. Graph Input Tool Market for Labor in the Fast Food Industry 20 18 16...
 4. Minimum wage legislation The following graph shows the labor market in the fast-food industry in the fictional town of Supersize City Use the graph input tool to help you answer the fallowing questions. You will not be graded on any changes you make to this graph Note: Once you entera value in a white field, the graph and any corresponding amounts in each grey ficld w change accordingly. Graph Input Tool Market for Labor in the Fast Food Industry...
 4. Minimum wage legislation The following graph shows the labor market in the fast-food industry in the fictional town of Supersize City. Use the graph input tool to help you answer the following questions. You will not be graded on any changes you make to this graph. Note: Once you enter a value in a white field, the graph and any corresponding amounts in each grey field will change accordingly. Graph Input Tool Market for Labor in the Fast Food...
 4. Minimum wage legislation The following graph shows the labor market in the fast-food industry in the fictional town of Supersize City. Use the graph input tool to help you answer the following questions. You will not be graded on any changes you make to this graph. Note: Once you enter a value in a white field, the graph and any corresponding amounts in each grey field will change accordingly. Graph Input Tool Market for Labor in the Fast Food...
 4. Minimum wage legisiation The following graph shows the labor market in the fast-food industry in the fictional town of Supersize aty. Use the graph input tool to help you answer the folowing questions You will not be gradest on aty changes you make to ths graph aph and any corresponding amounts in each grey field wil change accordinghy Note: Once you enter a value in a white field, the g Graph Input Tool Market for Labor in the Fast...
 The following graph shows the labor market in the fast-food
industry in the fictional town of Supersize City.Use the graph input tool to help you answer the following
questions. You will not be graded on any changes you make to this
graph.Note: Once you enter a value in a white field, the graph and any
corresponding amounts in each grey field will change
accordingly.In this market, the equilibrium hourly wage is___, and the
equilibrium quantity of labor is___ thousand workers.Suppose...
The following graph shows the labor market in the fast-food
industry in the fictional town of Supersize City.Use the graph input tool to help you answer the following
questions. You will not be graded on any changes you make to this
graph.Note: Once you enter a value in a white field, the graph and any
corresponding amounts in each grey field will change
accordingly.In this market, the equilibrium hourly wage is___, and the
equilibrium quantity of labor is___ thousand workers.Suppose...
 The following graph shows the labor market in the fast-food industry in the fictional town of Supersize City. Use the graph input tool to help you answer the following questions. You will not be graded on any changes you make to this graph. Note: Once you enter a value in a white field, the graph and any corresponding amounts in each grey field will change accordingly. Graph Input Tool Market for Labor in the Fast Food Industry Wage (Dollars per...
Most questions answered within 3 hours.
-
1. why is toluene a stronger nucleophile than benzene?
2.why is phenol a stronger nucleophile than...
asked 1 minute ago -
4. How can you solve for the density of the liquid from the
slope? Please show...
asked 1 minute ago -
when 2053 j of heat is added to 46.3 g of hexane C6H14 the
temperature increases...
asked 24 minutes ago -
I need new and unique answers, please. (Use your own words,
don't copy and paste), Please...
asked 27 minutes ago -
MCL 445.111 et seq. deals with Home Solicitation Sales.
MCL stands for Michigan Compiled Laws which...
asked 18 minutes ago -
Which of the following items may not create an NOL?
a.
sole proprietorship loss
b.
personal...
asked 23 minutes ago -
A hypothetical solution forms between a solid and a liquid. The
values of the thermodynamic quantities...
asked 21 minutes ago -
a)An ideal heat pump is being considered for use in heating an
environment with a temperature...
asked 25 minutes ago -
.
Convert the following pairs of voltage and current waveforms to
phasor form. Each pair of...
asked 26 minutes ago -
A 6.5 cm diameter ball has a terminal speed of 22 m/s. What is
the ball's...
asked 40 minutes ago -
Name two areas of the human body with the highest concentration
of lymph nodes and speculate...
asked 44 minutes ago -
Angel Corporation has $10,000,000 of
8.0% 25 year bonds dated May 1, 2018 with interest payable...
asked 1 hour ago