
Homework Answers
| Table | Absorption | mg/ml PNP |
| 1 | 0 | 0 |
| 2 | 0.133 | 0.063 |
| 3 | 0.264 | 0.125 |
| 4 | 0.530 | 0.25 |
| 5 | 0.95 | 0.5 |
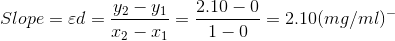
| 6 | 2.10 | 1 |
We can write C insted of PNP.
 In a graph of A vs. C, the slope is


Add Answer to:
Experiment 6: Factors affecting enzyme catalyzed reactions Data Page Name: 1. STANDARD CURVE Table 1: Standard...
Hi, please make the graph below is given the data. and also, comment on the following...
 Hi,
please make the graph below is given the data. and also,
comment on the following data given. please so it asap.
thanks
Tule 1 Standard Curve Tube # Abs. mg/ml PNP Use your standard curve to calculate molar absorptivity coefficient of PNP? Show work. 0.133 0.264 0:530 0.95 0 0.063 0.125 0.25 0.5 2. ENZYME REACTION OVER TIME Tube Reaction time Abs. 30 $ 6os 10 S ao s 50 N/A 011 0.202 0.355 0.489 0.690 Comment on the...
Hi,
please make the graph below is given the data. and also,
comment on the following data given. please so it asap.
thanks
Tule 1 Standard Curve Tube # Abs. mg/ml PNP Use your standard curve to calculate molar absorptivity coefficient of PNP? Show work. 0.133 0.264 0:530 0.95 0 0.063 0.125 0.25 0.5 2. ENZYME REACTION OVER TIME Tube Reaction time Abs. 30 $ 6os 10 S ao s 50 N/A 011 0.202 0.355 0.489 0.690 Comment on the...
Sucrose Levels Data: Tube # 1 2 3 4 5 6 7 8 9 `0 11...
Sucrose Levels Data: Tube # 1 2 3 4 5 6 7 8 9 `0 11 Water (mL) 1.0 0.75 0.5 0.25 Glucose Std. (mL) 0.25 0.5 0.75 1.0 Sucrose Std. (mL) 1.0 1.0 CONC. Extract (mL) 1.0 1.0 Diluted Extract (mL) 1.0 1.0 Buffer (mL) 1.0 1.0 1.0 1.0 1.0 1.0 1.0 1.0 TUBE VS ABSORBANCES: 1 blank 2 .071 3 .535 4 .551 5 .042 6 0 7 .306 8 .056 9 1.999 10 .025 11 .35 A)...
Based on the document below, 1. Describe the hypothesis Chaudhuri et al ids attempting to evaluate;...
 Based on the document below,
1. Describe the hypothesis Chaudhuri et al ids attempting to
evaluate; in other words, what is the goal of this paper? Why is he
writing it?
2. Does the data presented in the paper support the hypothesis
stated in the introduction? Explain.
3.According to Chaudhuri, what is the potential role of thew
alkaline phosphatase in the cleanup of industrial waste.
CHAUDHURI et al: KINETIC BEHAVIOUR OF CALF INTESTINAL ALP WITH PNPP 8.5, 9, 9.5, 10,...
Based on the document below,
1. Describe the hypothesis Chaudhuri et al ids attempting to
evaluate; in other words, what is the goal of this paper? Why is he
writing it?
2. Does the data presented in the paper support the hypothesis
stated in the introduction? Explain.
3.According to Chaudhuri, what is the potential role of thew
alkaline phosphatase in the cleanup of industrial waste.
CHAUDHURI et al: KINETIC BEHAVIOUR OF CALF INTESTINAL ALP WITH PNPP 8.5, 9, 9.5, 10,...
 Hi,
please make the graph below is given the data. and also,
comment on the following data given. please so it asap.
thanks
Tule 1 Standard Curve Tube # Abs. mg/ml PNP Use your standard curve to calculate molar absorptivity coefficient of PNP? Show work. 0.133 0.264 0:530 0.95 0 0.063 0.125 0.25 0.5 2. ENZYME REACTION OVER TIME Tube Reaction time Abs. 30 $ 6os 10 S ao s 50 N/A 011 0.202 0.355 0.489 0.690 Comment on the...
Hi,
please make the graph below is given the data. and also,
comment on the following data given. please so it asap.
thanks
Tule 1 Standard Curve Tube # Abs. mg/ml PNP Use your standard curve to calculate molar absorptivity coefficient of PNP? Show work. 0.133 0.264 0:530 0.95 0 0.063 0.125 0.25 0.5 2. ENZYME REACTION OVER TIME Tube Reaction time Abs. 30 $ 6os 10 S ao s 50 N/A 011 0.202 0.355 0.489 0.690 Comment on the...
 Based on the document below,
1. Describe the hypothesis Chaudhuri et al ids attempting to
evaluate; in other words, what is the goal of this paper? Why is he
writing it?
2. Does the data presented in the paper support the hypothesis
stated in the introduction? Explain.
3.According to Chaudhuri, what is the potential role of thew
alkaline phosphatase in the cleanup of industrial waste.
CHAUDHURI et al: KINETIC BEHAVIOUR OF CALF INTESTINAL ALP WITH PNPP 8.5, 9, 9.5, 10,...
Based on the document below,
1. Describe the hypothesis Chaudhuri et al ids attempting to
evaluate; in other words, what is the goal of this paper? Why is he
writing it?
2. Does the data presented in the paper support the hypothesis
stated in the introduction? Explain.
3.According to Chaudhuri, what is the potential role of thew
alkaline phosphatase in the cleanup of industrial waste.
CHAUDHURI et al: KINETIC BEHAVIOUR OF CALF INTESTINAL ALP WITH PNPP 8.5, 9, 9.5, 10,...
Most questions answered within 3 hours.
-
What are the characteristics and behavior of an ethical
manager?
Explain, in your words, what ethics...
asked 17 minutes ago -
1. Which of the following is NOT an argument that McMahan uses
to show that jus...
asked 38 minutes ago -
A crate slides up a frictionless slope. At the end of 3 seconds
its velocity is...
asked 55 minutes ago -
Use the following information to answer the next seven
questions.
Suppose there are three potential states...
asked 51 minutes ago -
If we only have interstitial and substitutional diffusion, then
what do we consider the process of...
asked 1 hour ago -
You look at yourself in a shiny 9.6-cm-diameter Christmas tree
ball.
If your face is 21.0...
asked 1 hour ago -
If we were to measure the relaxation time of a muscle after
undergoing tetanus compared to...
asked 1 hour ago -
4CO(g) + 8H2(g) -----> 3CH4(g) +
CO2(g) + 2H2O(l)
Use the following data as needed to...
asked 1 hour ago -
without using map
1. Write a C++ program to find out the top 10 words in...
asked 1 hour ago -
1)Calculate the percent ionization of a
0.330 M solution of hypochlorous
acid.
% Ionization = %...
asked 1 hour ago -
1a) How many grams of K2SO4 are in 250mL
of 0.11 M K2SO4 solution?
_____ g...
asked 1 hour ago -
The vapor pressure of a solution containing 38.7 g glycerin
(C3H8O3) in 146.2 g ethanol (C2H5OH)...
asked 1 hour ago