Ecology question: how would you make a graph of how population size changes over time for...
Ecology question: how would you make a graph of how population
size changes over time for a population of owls with per capita
growth rate =0.5 and carrying capacity=200 that starts at a low
population size. i want to see numbers on the y axis but there
doesn't need to be numbers on the x axis, also how would the axes
be labeled.
Homework Answers
Key points:
-
In exponential growth, a population's per capita (per individual) growth rate stays the same regardless of population size, making the population grow faster and faster as it gets larger.
-
dn/dt= rN
-
 the graph for above problem is
given below
the graph for above problem is
given below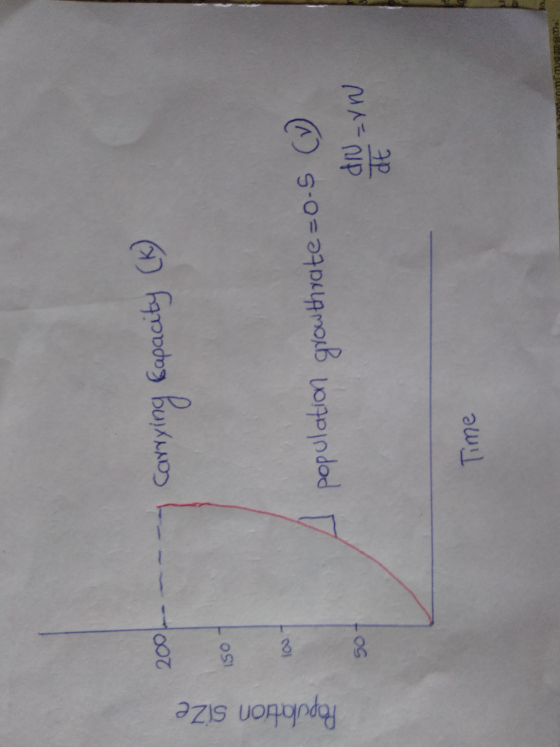
 the graph for above problem is
given below
the graph for above problem is
given below
Add Answer to:
Ecology question: how would you make a graph of how population
size changes over time for...
QUESTION 4 This graph shows how the growth rate of a certain population changes with population...
 QUESTION 4 This graph shows how the growth rate of a certain population changes with population size. A A If the population starts at size "x", what will be the eventual size of the dN/dt population (choose A-E)? OOOO QUESTION 5 This graph shows the per-capita birth and death rates for a certain population as a function of population size, N.  If the population starts at size "x", what will be the eventual size of the population (choose A-E)?...
Use the following graph to answer Question 2. Population size Time This graph shows the population...
 Use the following graph to answer Question 2. Population size Time This graph shows the population growth of the common pheasant, one of the world's most hunted birds. On the graph, X represents (a) carrying capacity. (b) maximum sustainable yield. (c) resource depletion. (d) endangered species designation. (e) population overshoot.
3. The graph below has axes to show the population sizes of a predator and its...
 3. The graph below has axes to show the population sizes of a predator and its prey. The dashed lines are the predator and prey isoclines. Prey Population Starting at the circle, draw in what will happen to the two populations if they are following the pattern in the Lotka-Volterra model of predation. (Remember that BOTH predator and prey numbers are represented by a point on the graph.) Use a series of arrows to show what happens. 2. Imagine two...
The graphs show how yield Nild changes with population size N in two populations. Based on...
 The graphs show how yield Nild changes with population size N in two populations. Based on the relationships, you would conclude 10000 5000 10000 20000 30000 500 1000 1500 2000 A. The population on the left shows density independent growth and the per capita growth rater is a constant B. The population on the left shows density dependent growth and the per capita growth rater is a variable C. The population on the right shows density independent growth and the...
The graphs show how yield Nidt changes with population size N in two populations. Based on...
 The graphs show how yield Nidt changes with population size N in two populations. Based on the relationships, you would conclude 10000 0 5000 10000 20000 30000 500 1000 1500 2000 The population on the left shows density independent growth and the per capita growth rater is a constant 6. The population on the left show density dependent growth and the per capita growth rater is a variable The population on the right shows density independent growth and the per...
The graphs show how yield dN/dt changes with population size N in two populations. Based on...
 The graphs show how yield dN/dt changes with population size N in two populations. Based on the relationships, you would conclude 10000 8000 IP/NP 0 5000 10000 20000 30000 500 1000 1500 2000 A. The population on the left shows density independent growth and the per capita growth rater is a constant B. The population on the left shows density dependent growth and the per capita growth rater is a variable 6. The population on the right shows density independent...
a) You are studying a population of aphids with an initial population size of 500. During...
 a) You are studying a population of aphids with an initial
population size of 500. During a one-month period, you observe 40
births and 15 deaths in the population. Estimate the value of r for
that month, and predict the population size in three months (from
the initial population size). Remember that r is the per capita
rate of population increase. (Assume exponential population
growth).
b) Imagine you are growing ciliates in a laboratory flask. The
carrying capacity is 1000...
a) You are studying a population of aphids with an initial
population size of 500. During a one-month period, you observe 40
births and 15 deaths in the population. Estimate the value of r for
that month, and predict the population size in three months (from
the initial population size). Remember that r is the per capita
rate of population increase. (Assume exponential population
growth).
b) Imagine you are growing ciliates in a laboratory flask. The
carrying capacity is 1000...
help me out 18. The graph below shows a model of population changes over time in...
 help me out
18. The graph below shows a model of population changes over time in a predator and its prey. Prey Population Size Predator Population Size Predator Which of the following data would be most helpful in predicting possible disruptions to the relationship between the predator and its prey? (A) Time of day, because a day become shorter time hunting increases (B) Average birth weight of predators, because heavier offspring will begin hunting at younger ages (C) Numbers of...
help me out
18. The graph below shows a model of population changes over time in a predator and its prey. Prey Population Size Predator Population Size Predator Which of the following data would be most helpful in predicting possible disruptions to the relationship between the predator and its prey? (A) Time of day, because a day become shorter time hunting increases (B) Average birth weight of predators, because heavier offspring will begin hunting at younger ages (C) Numbers of...
How do the national income accounts change if social security payments increase? A) Consumption falls. B)...
How do the national income accounts change if social security payments increase? A) Consumption falls. B) Consumption rises. C) Savings rise. D) This change is not captured in the national income accounts. How do the national income accounts change if unemployment benefits paid to people increase? A) Consumption falls. B) Consumption rises. C) Savings rise. D) This change is not captured in the national income accounts. How do the national income accounts change if national defense spending increases? A) Government...
(question)What three investments would you make a priority to reduce the deaths of under-five children in...
(question)What three investments would you make a priority to reduce the deaths of under-five children in Skolnikland in the short run? Describe specifically what causes of death each priority investment would reduce The Case: Skolnikland is in Southeastern Africa. It has 30 million people. The country has a plains region, a hill region, and a region with high mountains. It has a number of ecosystems. The plains are dry for much of the year, there is some rainforest, and the...
 QUESTION 4 This graph shows how the growth rate of a certain population changes with population size. A A If the population starts at size "x", what will be the eventual size of the dN/dt population (choose A-E)? OOOO QUESTION 5 This graph shows the per-capita birth and death rates for a certain population as a function of population size, N.  If the population starts at size "x", what will be the eventual size of the population (choose A-E)?...
 Use the following graph to answer Question 2. Population size Time This graph shows the population growth of the common pheasant, one of the world's most hunted birds. On the graph, X represents (a) carrying capacity. (b) maximum sustainable yield. (c) resource depletion. (d) endangered species designation. (e) population overshoot.
 3. The graph below has axes to show the population sizes of a predator and its prey. The dashed lines are the predator and prey isoclines. Prey Population Starting at the circle, draw in what will happen to the two populations if they are following the pattern in the Lotka-Volterra model of predation. (Remember that BOTH predator and prey numbers are represented by a point on the graph.) Use a series of arrows to show what happens. 2. Imagine two...
 The graphs show how yield Nild changes with population size N in two populations. Based on the relationships, you would conclude 10000 5000 10000 20000 30000 500 1000 1500 2000 A. The population on the left shows density independent growth and the per capita growth rater is a constant B. The population on the left shows density dependent growth and the per capita growth rater is a variable C. The population on the right shows density independent growth and the...
 The graphs show how yield Nidt changes with population size N in two populations. Based on the relationships, you would conclude 10000 0 5000 10000 20000 30000 500 1000 1500 2000 The population on the left shows density independent growth and the per capita growth rater is a constant 6. The population on the left show density dependent growth and the per capita growth rater is a variable The population on the right shows density independent growth and the per...
 The graphs show how yield dN/dt changes with population size N in two populations. Based on the relationships, you would conclude 10000 8000 IP/NP 0 5000 10000 20000 30000 500 1000 1500 2000 A. The population on the left shows density independent growth and the per capita growth rater is a constant B. The population on the left shows density dependent growth and the per capita growth rater is a variable 6. The population on the right shows density independent...
 a) You are studying a population of aphids with an initial
population size of 500. During a one-month period, you observe 40
births and 15 deaths in the population. Estimate the value of r for
that month, and predict the population size in three months (from
the initial population size). Remember that r is the per capita
rate of population increase. (Assume exponential population
growth).
b) Imagine you are growing ciliates in a laboratory flask. The
carrying capacity is 1000...
a) You are studying a population of aphids with an initial
population size of 500. During a one-month period, you observe 40
births and 15 deaths in the population. Estimate the value of r for
that month, and predict the population size in three months (from
the initial population size). Remember that r is the per capita
rate of population increase. (Assume exponential population
growth).
b) Imagine you are growing ciliates in a laboratory flask. The
carrying capacity is 1000...
 help me out
18. The graph below shows a model of population changes over time in a predator and its prey. Prey Population Size Predator Population Size Predator Which of the following data would be most helpful in predicting possible disruptions to the relationship between the predator and its prey? (A) Time of day, because a day become shorter time hunting increases (B) Average birth weight of predators, because heavier offspring will begin hunting at younger ages (C) Numbers of...
help me out
18. The graph below shows a model of population changes over time in a predator and its prey. Prey Population Size Predator Population Size Predator Which of the following data would be most helpful in predicting possible disruptions to the relationship between the predator and its prey? (A) Time of day, because a day become shorter time hunting increases (B) Average birth weight of predators, because heavier offspring will begin hunting at younger ages (C) Numbers of...
Most questions answered within 3 hours.
-
How much 0.1200 M sodium hydroxide solution is need to titrate
14 mL of a 0.100...
asked 3 minutes ago -
1a)When a 5000-kg roller coaster train full of riders approaches
the loading dock at a speed...
asked 28 minutes ago -
The Poseidon Swim Company produces swim trunks. The average
selling price for one of their swim...
asked 23 minutes ago -
If the elasticity of supply of a good is ∞, then its
A. supply curve is...
asked 9 minutes ago -
An impulse is a change in momentum usually over
a short time. For which of the...
asked 8 minutes ago -
Write an application for the Shady Rest Hotel; the program
determines the price of a room....
asked 14 minutes ago -
USE THE FOLLOWING INFORMATION TO ANSWER THE NEXT (6)
QUESTIONS:
The following is a December 31,...
asked 30 minutes ago -
Suppose you plan to invest $5,000 each year (beginning at the
end of this year) into...
asked 20 minutes ago -
What is the cell potential of the following cell at 25
oC? Note Au is a...
asked 21 minutes ago -
DNA to Protein
Describe the mutation that created the HbS allele:
type of mutation, location of...
asked 27 minutes ago -
Which attribute allows you to specify a custom "thumbnail" for
multimedia elements?
asked 28 minutes ago -
1. Why are the advantages and disadvantages of object-oriented
databases? 2. What are data marts? How...
asked 47 minutes ago