
Homework Answers
4)Ans - population are competing for same resource.they will
exert negative growth effect on each other,also see attached
file.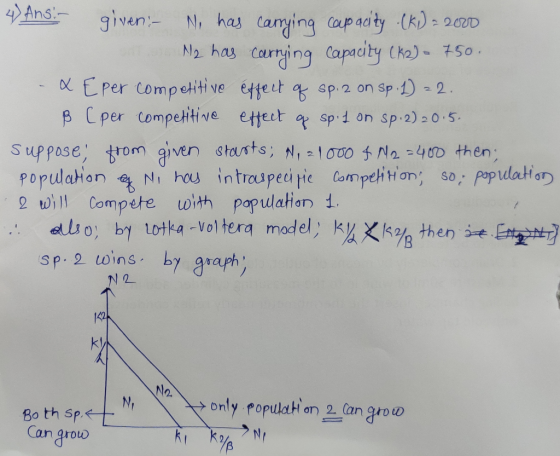
Add Answer to:
4. Assume two populations are competing for a shared limiting resource. Population N, has a carrying...
1- Assume a pond’s carrying capacity of frogs is 300 and the intrinsic growth rate is...
1- Assume a pond’s carrying capacity of frogs is 300 and the intrinsic growth rate is 0.3. What is the growth rate of frogs if there are 30 individuals currently present? Hint: dN/dt=rN((K-N)/K). a. 8 b. 5 c. 13 d. 3 2- If a starting population of cicadas is 100, the birth rate per capita is 0.6, the death rate per capita is 0.3, how big will the population of cicadas at 10 years? Hint: Nt=N0ert, r=b-d, and e=2.718. a....
3. The graph below has axes to show the population sizes of a predator and its...
 3. The graph below has axes to show the population sizes of a predator and its prey. The dashed lines are the predator and prey isoclines. Prey Population Starting at the circle, draw in what will happen to the two populations if they are following the pattern in the Lotka-Volterra model of predation. (Remember that BOTH predator and prey numbers are represented by a point on the graph.) Use a series of arrows to show what happens. 2. Imagine two...
The graphs show how yield Nild changes with population size N in two populations. Based on...
 The graphs show how yield Nild changes with population size N in two populations. Based on the relationships, you would conclude 10000 5000 10000 20000 30000 500 1000 1500 2000 A. The population on the left shows density independent growth and the per capita growth rater is a constant B. The population on the left shows density dependent growth and the per capita growth rater is a variable C. The population on the right shows density independent growth and the...
The graphs show how yield Nidt changes with population size N in two populations. Based on...
 The graphs show how yield Nidt changes with population size N in two populations. Based on the relationships, you would conclude 10000 0 5000 10000 20000 30000 500 1000 1500 2000 The population on the left shows density independent growth and the per capita growth rater is a constant 6. The population on the left show density dependent growth and the per capita growth rater is a variable The population on the right shows density independent growth and the per...
The graphs show how yield dN/dt changes with population size N in two populations. Based on...
 The graphs show how yield dN/dt changes with population size N in two populations. Based on the relationships, you would conclude 10000 8000 IP/NP 0 5000 10000 20000 30000 500 1000 1500 2000 A. The population on the left shows density independent growth and the per capita growth rater is a constant B. The population on the left shows density dependent growth and the per capita growth rater is a variable 6. The population on the right shows density independent...
 3. The graph below has axes to show the population sizes of a predator and its prey. The dashed lines are the predator and prey isoclines. Prey Population Starting at the circle, draw in what will happen to the two populations if they are following the pattern in the Lotka-Volterra model of predation. (Remember that BOTH predator and prey numbers are represented by a point on the graph.) Use a series of arrows to show what happens. 2. Imagine two...
 The graphs show how yield Nild changes with population size N in two populations. Based on the relationships, you would conclude 10000 5000 10000 20000 30000 500 1000 1500 2000 A. The population on the left shows density independent growth and the per capita growth rater is a constant B. The population on the left shows density dependent growth and the per capita growth rater is a variable C. The population on the right shows density independent growth and the...
 The graphs show how yield Nidt changes with population size N in two populations. Based on the relationships, you would conclude 10000 0 5000 10000 20000 30000 500 1000 1500 2000 The population on the left shows density independent growth and the per capita growth rater is a constant 6. The population on the left show density dependent growth and the per capita growth rater is a variable The population on the right shows density independent growth and the per...
 The graphs show how yield dN/dt changes with population size N in two populations. Based on the relationships, you would conclude 10000 8000 IP/NP 0 5000 10000 20000 30000 500 1000 1500 2000 A. The population on the left shows density independent growth and the per capita growth rater is a constant B. The population on the left shows density dependent growth and the per capita growth rater is a variable 6. The population on the right shows density independent...
Most questions answered within 3 hours.
-
Calculate the approximate number of residues of Rubisco, which
is involved in carbon fixation in plants,...
asked 25 minutes ago -
Other decisions about scientific claims can have a much broader
impact.ENERGYarrow-10x10.png, environment, health, security - all...
asked 1 hour ago -
I need to write a research paper and work cited about this
topic: The United States...
asked 1 hour ago -
Hello! I was wondering if I could have some help?
If the vapor pressure of carvone...
asked 2 hours ago -
An economist wants to estimate the mean per capita income (in
thousands of dollars) for a...
asked 2 hours ago -
What would be the input/output characteristic of a circuit
obtained by putting two of your 2's-complementers...
asked 2 hours ago -
In Drosophila, the transition from the syncytial blastoderm
stage to the cellular blastoderm stage is a...
asked 2 hours ago -
Project management question:
Name 3 different types of resources (hint: humans are one
type)
asked 3 hours ago -
Consider the following reaction: C 2H 2( g) + 2H 2( g) C 2H 6(
g)...
asked 3 hours ago -
Consider a 1.0 L buffer containing 0.092 mol L-1 HCOOH and 0.100
mol L-1 HCOO-. What...
asked 3 hours ago -
Koch Realty has owned a vacant land with a FMV of
$775,000 and an adjusted basis...
asked 3 hours ago -
It is estimated 29% of all adults in United States invest in
stocks and that 85%...
asked 3 hours ago