A small town is served by many competing supermarkets, which all have the same constant marginal...
|
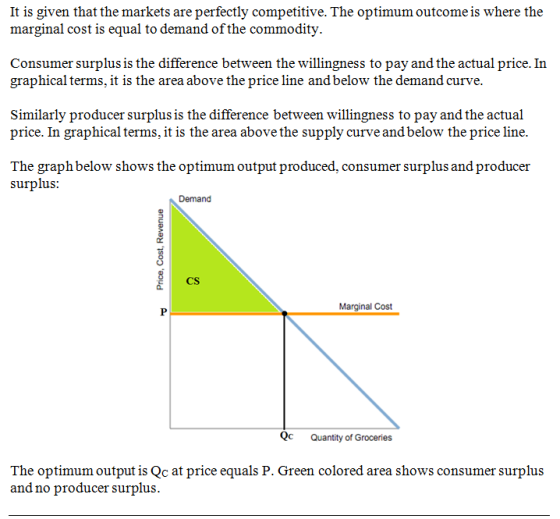
A small town is served by many competing supermarkets, which all have the same constant marginal cost. Use the black point (plus symbol) to show the competitive price and quantity in this market. Then use the green area (triangle symbol) to shade the area representing consumer surplus in the market for groceries, and use the purple area (diamond symbol) to shade the area representing producer surplus.
Now suppose that the independent supermarkets combine into one chain. Use the black point (plus symbol) to show the profit-maximizing monopoly outcome. Then use the green area (triangle symbol) to shade the area representing consumer surplus in the market for groceries, and use the purple area (diamond symbol) to shade the area representing producer surplus. Finally, use the black area (plus symbol) to shade the area representing deadweight loss.
|


Homework Answers

Add Answer to:
A small town is served by many competing supermarkets, which all have the same constant marginal...
A small town is served by many competing supermarkets, which have constant marginal cost. a Using...
 A small town is served by many competing supermarkets, which have constant marginal cost. a Using a diagram of the market for groceries, show the consumer surplus, producer surplus and total surplus. Now suppose that the independent supermarkets combine to form one chain. Using a new diagram, show the new consumer surplus, producer surplus and total surplus. Relative to the competitive market, what is the transfer from consumers to producers? What is the deadweight loss? b
2. A small town is served by many competing supermarkets, which have the same constant marginal cost. a. Using a diagram of the market for groceries, show the consumer surplus, producer surplus,...
 2. A small town is served by many competing supermarkets, which have the same constant marginal cost. a. Using a diagram of the market for groceries, show the consumer surplus, producer surplus, and total surplus. b. Now suppose that the independent super- markets combine into one chain. Using a new diagram, show the new consumer surplus, producer surplus, and total surplus. Relative to the competitive market, what is the transfer from consumers to producers? What is the deadweight loss?
2....
2. A small town is served by many competing supermarkets, which have the same constant marginal cost. a. Using a diagram of the market for groceries, show the consumer surplus, producer surplus, and total surplus. b. Now suppose that the independent super- markets combine into one chain. Using a new diagram, show the new consumer surplus, producer surplus, and total surplus. Relative to the competitive market, what is the transfer from consumers to producers? What is the deadweight loss?
2....
Consider the market for mountain bikes. The following graph shows the demand and supply for mountain bikes before the government imposes any taxes.
 Consider the market for mountain bikes. The following graph shows the demand and supply for mountain bikes before the government imposes any taxes. First, use tfhe black point (plus symbol) to indicate the equilibrium price and quantity of mountain bikes in the absence of a tax. Then use the green point (triangle symbol) to shade the area representing total consumer surplus (CS) at the equilibrium price. Next, use the purple point (diamond symbol) to shade the area representing total producer surplus...
Consider the market for mountain bikes. The following graphshows the demand and supply for mountain...
 Consider the market for mountain bikes. The following graph
shows the demand and supply for mountain bikes before the
government imposes any taxes. First, use the black point (plus
symbol) to indicate the equilibrium price and quantity of mountain
bikes in the absence of a tax. Then use the green point (triangle
symbol) to shade the area representing total consumer surplus (CS)
at the equilibrium price. Next, use the purple point (diamond
symbol) to shade the area representing total producer...
Consider the market for mountain bikes. The following graph
shows the demand and supply for mountain bikes before the
government imposes any taxes. First, use the black point (plus
symbol) to indicate the equilibrium price and quantity of mountain
bikes in the absence of a tax. Then use the green point (triangle
symbol) to shade the area representing total consumer surplus (CS)
at the equilibrium price. Next, use the purple point (diamond
symbol) to shade the area representing total producer...
Consider the market for designer purses. The following graphshows the demand and supply for designer...
 Consider the market for designer purses. The following graph
shows the demand and supply for designer purses before the
government imposes any taxes.First, use the black point (plus symbol) to indicate the
equilibrium price and quantity of designer purses in the absence of
a tax. Then use the green point (triangle symbol) to shade the area
representing total consumer surplus (CS) at the equilibrium price.
Next, use the purple point (diamond symbol) to shade the area
representing total producer surplus...
Consider the market for designer purses. The following graph
shows the demand and supply for designer purses before the
government imposes any taxes.First, use the black point (plus symbol) to indicate the
equilibrium price and quantity of designer purses in the absence of
a tax. Then use the green point (triangle symbol) to shade the area
representing total consumer surplus (CS) at the equilibrium price.
Next, use the purple point (diamond symbol) to shade the area
representing total producer surplus...
Consider the market for mountain bikes. The following graph shows the demand and supply for mountain bikes before the government imposes any taxes.
 Consider the market for mountain bikes. The following graph shows the demand and supply for mountain bikes before the government imposes any taxes. First, use the black point (plus symbol) to indicate the equilibrium price and quantity of mountain bikes in the absence of a tax. Then use the green point (triangle symbol) to shade the area representing total consumer surplus (CS) at the equilibrium price. Next, use the purple point (diamond symbol) to shade the area representing total producer surplus...
Consider the market for designer purses. The following graph shows the demand and supply for designer purses before the government imposes any taxes.
 2. Taxes and welfare Consider the market for designer purses. The following graph shows the demand and supply for designer purses before the government imposes any taxes. First, use the black point (plus symbol) to indicate the equilibrium price and quantity of designer purses in the absence of a tax. Then use the green point (triangle symbol) to shade the area representing total consumer surplus (CS) at the equilibrium price. Next, use the purple point (diamond symbol) to shade the area representing...
Consider the market for mountain bikes. The following graph shows the demand and supply for mountain bikes before the govemment imposes any taxes.
 2. Taxes and welfare Consider the market for mountain bikes. The following graph shows the demand and supply for mountain bikes before the govemment imposes any taxes. First, use the black point (plus symbol) to indicate the equilibrium price and quantity of mountain bikes in the absence of a tax. Then use the green point (triangle symbol) to shade the area representing total consumer surplus (CS) at the equilibrium price. Next, use the purple point (diamond symbol) to shade the area representing...
Consider the market for commercial fans. The following graph shows the demand and supply for commercial fans before the government imposes any taxes.
 Consider the market for commercial fans. The following graph shows the demand and supply for commercial fans before the government imposes any taxes. First, use the black point (plus symbol) to indicate the equilibrium price and quantity of commercial fans in the absence of a tax. Then use the green point (triangle symbol) to shade the area representing total consumer surplus (CS) at the equilibrium price. Next, use the purple point (diamond symbol) to shade the area representing total producer surplus...
 A small town is served by many competing supermarkets, which have constant marginal cost. a Using a diagram of the market for groceries, show the consumer surplus, producer surplus and total surplus. Now suppose that the independent supermarkets combine to form one chain. Using a new diagram, show the new consumer surplus, producer surplus and total surplus. Relative to the competitive market, what is the transfer from consumers to producers? What is the deadweight loss? b
 2. A small town is served by many competing supermarkets, which have the same constant marginal cost. a. Using a diagram of the market for groceries, show the consumer surplus, producer surplus, and total surplus. b. Now suppose that the independent super- markets combine into one chain. Using a new diagram, show the new consumer surplus, producer surplus, and total surplus. Relative to the competitive market, what is the transfer from consumers to producers? What is the deadweight loss?
2....
2. A small town is served by many competing supermarkets, which have the same constant marginal cost. a. Using a diagram of the market for groceries, show the consumer surplus, producer surplus, and total surplus. b. Now suppose that the independent super- markets combine into one chain. Using a new diagram, show the new consumer surplus, producer surplus, and total surplus. Relative to the competitive market, what is the transfer from consumers to producers? What is the deadweight loss?
2....
 Consider the market for mountain bikes. The following graph
shows the demand and supply for mountain bikes before the
government imposes any taxes. First, use the black point (plus
symbol) to indicate the equilibrium price and quantity of mountain
bikes in the absence of a tax. Then use the green point (triangle
symbol) to shade the area representing total consumer surplus (CS)
at the equilibrium price. Next, use the purple point (diamond
symbol) to shade the area representing total producer...
Consider the market for mountain bikes. The following graph
shows the demand and supply for mountain bikes before the
government imposes any taxes. First, use the black point (plus
symbol) to indicate the equilibrium price and quantity of mountain
bikes in the absence of a tax. Then use the green point (triangle
symbol) to shade the area representing total consumer surplus (CS)
at the equilibrium price. Next, use the purple point (diamond
symbol) to shade the area representing total producer...
 Consider the market for designer purses. The following graph
shows the demand and supply for designer purses before the
government imposes any taxes.First, use the black point (plus symbol) to indicate the
equilibrium price and quantity of designer purses in the absence of
a tax. Then use the green point (triangle symbol) to shade the area
representing total consumer surplus (CS) at the equilibrium price.
Next, use the purple point (diamond symbol) to shade the area
representing total producer surplus...
Consider the market for designer purses. The following graph
shows the demand and supply for designer purses before the
government imposes any taxes.First, use the black point (plus symbol) to indicate the
equilibrium price and quantity of designer purses in the absence of
a tax. Then use the green point (triangle symbol) to shade the area
representing total consumer surplus (CS) at the equilibrium price.
Next, use the purple point (diamond symbol) to shade the area
representing total producer surplus...
Most questions answered within 3 hours.
-
Accounts receivable subsidiary ledger, schedule of
accounts receivable lo c1. Vali company recorded the following
selected...
asked 1 minute ago -
Connell performed a series of studies to understand what limits
the distribution of barnacle species within...
asked 5 minutes ago -
I throw a die with 6 sides. Consider the events, A=uneven and
B=prime number. Find the...
asked 8 minutes ago -
Common-Sized Income Statement
Revenue and expense data for the current calendar year for
Tannenhill Company and...
asked 26 minutes ago -
Find the present value of an annuity due that pays $3000 at the
beginning of each...
asked 35 minutes ago -
A reaction is second order with respect to [A] and half order
with respect to [B]....
asked 34 minutes ago -
In your groups, list the international actors you would expect
to encounter in an emergency logistics...
asked 54 minutes ago -
When one molecule of methane combusts with oxygen, 5.74 X
10-21 J is released as heat....
asked 1 hour ago -
Required information
[The following information applies to the questions
displayed below.]
Satellite Systems modified its model...
asked 1 hour ago -
High Normal blood pressure is categorized as which of
the following?
140-159/90-99
120/80
130-139/85-89
160/100
asked 1 hour ago -
Please I need help with MATLAB .. PLease help me . Thankyou
Write Matlab code to...
asked 1 hour ago -
You are saving towards purchasing a house and currently have
$20,000 in an account that earns...
asked 1 hour ago