
Homework Answers
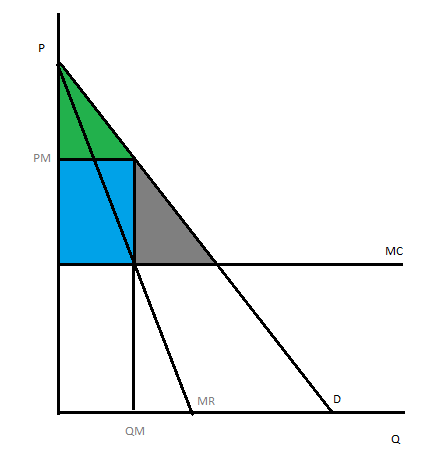
A) When the market is competitive,the firm will set P=MC for profit maximization where Q=QC and P=PC,so there is no producer surplus or deadweight loss in the market as the market is producing an efficient output.

B) When the market changes into a monopoly,the firm will set MC=MR for profit maximization where Q=QM and P=PM, so that the consumer surplus decreases,the blue shaded area is transferred to the producer and the grey area represents the deadweight loss.
Add Answer to:
2. A small town is served by many competing supermarkets, which have the same constant marginal cost. a. Using a diagram of the market for groceries, show the consumer surplus, producer surplus,...
A small town is served by many competing supermarkets, which have constant marginal cost. a Using...
 A small town is served by many competing supermarkets, which have constant marginal cost. a Using a diagram of the market for groceries, show the consumer surplus, producer surplus and total surplus. Now suppose that the independent supermarkets combine to form one chain. Using a new diagram, show the new consumer surplus, producer surplus and total surplus. Relative to the competitive market, what is the transfer from consumers to producers? What is the deadweight loss? b
A small town is served by many competing supermarkets, which all have the same constant marginal...
 A small town is served by many competing supermarkets, which all have the same constant marginal cost.
Use the black point (plus symbol) to show the competitive price and quantity in this market. Then use the green area (triangle symbol) to shade the area representing consumer surplus in the market for groceries, and use the purple area (diamond symbol) to shade the area representing producer surplus.
Now suppose that the independent supermarkets combine into one chain.
Use the black point...
A small town is served by many competing supermarkets, which all have the same constant marginal cost.
Use the black point (plus symbol) to show the competitive price and quantity in this market. Then use the green area (triangle symbol) to shade the area representing consumer surplus in the market for groceries, and use the purple area (diamond symbol) to shade the area representing producer surplus.
Now suppose that the independent supermarkets combine into one chain.
Use the black point...
A small town is served by many competing supermarkets, which all have the same constant marginal...
 A small town is served by many competing supermarkets, which all have the same constant marginal cost.
2. EXERCISE 8.4 SURPLUS AND DEADWEIGHT LOSs 1. Sketch a diagram to illustrate the competitive market...
 2. EXERCISE 8.4 SURPLUS AND DEADWEIGHT LOSs 1. Sketch a diagram to illustrate the competitive market for bread, showing the equilibrium where 5,000 loaves are sold at a price of 2.00. 2. Suppose that the bakeries get together to form a cartel. They agree to raise the price to 2.70, and jointly cut production to supply the number of loaves that consumers demand at that price. Shade the areas on your diagram to show the consumer surplus, producer surplus, and...
PL P 21. Problem 16 points Suppose Djibouti is a small part of the world market...
 PL P 21. Problem 16 points Suppose Djibouti is a small part of the world market for hockey sticks and the capital is l-spanka a. (7 points) Draw a graph depicting the cuilibrium in the Dibouti hockey stick market in a world without trade, labeling everything, including the couilibrium price & quantity and both consumer & producer surplus. (You may create demand and supply schedules using numbers if you wish but you are not required to do so). Please show...
whole question: Just answer as many as possible, dont have to be 100% 1. Consider the...
 whole question: Just answer as many as possible, dont have to be
100%
1. Consider the market for dried beans in a small town of 9,000 consumers. Let each consumer's preferences over beans (B, in pounds) and other goods (G) be given by U(B,G) = 120 +G For the rest of this question, fix the price of other goods at PG = 1 and let each consumer have a total weekly budget of I = 100. (a) Write the budget...
whole question: Just answer as many as possible, dont have to be
100%
1. Consider the market for dried beans in a small town of 9,000 consumers. Let each consumer's preferences over beans (B, in pounds) and other goods (G) be given by U(B,G) = 120 +G For the rest of this question, fix the price of other goods at PG = 1 and let each consumer have a total weekly budget of I = 100. (a) Write the budget...
Show answers Consider a market in which there are 9 identical firms. Marginal cost of each...
Show answers Consider a market in which there are 9 identical firms. Marginal cost of each firm is given by MCi= 2qi, and there are no fixed costs. Market demand is given by Qd= 90- 3P. 27) Refer to Scenario 2. Assume perfect competition, so each firm is a price taker; then at market equilibrium, P= $______; Q= ______; and qi= ______. 28) Refer to Scenario 2. Assume perfect competition, ...; then at market equilibrium, each firm makes profits= $______;...
Part II: Market Failure in the Passenger Airline Industry and Policy (30%) For full marks: Craphs:...
 Part II: Market Failure in the Passenger Airline Industry and Policy (30%) For full marks: Craphs: Plot graphs to scale on graph paper by hand, include a figure number, title, and label all axis including correct units, be neat and tidy and put in order in the assignment. Introduce the graph with a sentence before it. 2) For algebra, use short sentences to guide the reader (SSTGR) through your work. Example: "To find the perfectly competitive market equilibrium global daily...
13) The cost the Almy type of market 7) The market is an example of A)...
 13) The cost the Almy type of market 7) The market is an example of A) mattress: a monopoly B) com a perfectly competitive C) car insurance an oligopoly D) cell phone; a perfectly competitive 5) airplane manufacturing a monopolistically competitive 8) What is the difference between perfect competition and monopolistic competition? A) Perfect competition has a large number of small firms while monopolistic competition does not in monopolistic competition, firms produce identical goods, while in perfect competition, firms produce...
Question 2 (15 points) Continuing your analysis of the competitive US manufacturing industry from Question 1,...
 Question 2 (15 points) Continuing your analysis of the competitive US manufacturing industry from Question 1, with demand of Q = 200-P and supply of Q. = P-20, suppose a technological innovation causes the supply curve to shift down by $20 for every given quantity Q. • Depict the original supply, the new supply, and the original demand curves on the usual P, Q diagram. Label all intercepts. Clearly indicate and label the new market equilibrium. 2/8/2 compass 20 Mlinois.edu/bbcswebdavipid-4037356-dt-con020%20ECON528%20M6...
 A small town is served by many competing supermarkets, which have constant marginal cost. a Using a diagram of the market for groceries, show the consumer surplus, producer surplus and total surplus. Now suppose that the independent supermarkets combine to form one chain. Using a new diagram, show the new consumer surplus, producer surplus and total surplus. Relative to the competitive market, what is the transfer from consumers to producers? What is the deadweight loss? b
 A small town is served by many competing supermarkets, which all have the same constant marginal cost.
Use the black point (plus symbol) to show the competitive price and quantity in this market. Then use the green area (triangle symbol) to shade the area representing consumer surplus in the market for groceries, and use the purple area (diamond symbol) to shade the area representing producer surplus.
Now suppose that the independent supermarkets combine into one chain.
Use the black point...
A small town is served by many competing supermarkets, which all have the same constant marginal cost.
Use the black point (plus symbol) to show the competitive price and quantity in this market. Then use the green area (triangle symbol) to shade the area representing consumer surplus in the market for groceries, and use the purple area (diamond symbol) to shade the area representing producer surplus.
Now suppose that the independent supermarkets combine into one chain.
Use the black point...
 A small town is served by many competing supermarkets, which all have the same constant marginal cost.
 2. EXERCISE 8.4 SURPLUS AND DEADWEIGHT LOSs 1. Sketch a diagram to illustrate the competitive market for bread, showing the equilibrium where 5,000 loaves are sold at a price of 2.00. 2. Suppose that the bakeries get together to form a cartel. They agree to raise the price to 2.70, and jointly cut production to supply the number of loaves that consumers demand at that price. Shade the areas on your diagram to show the consumer surplus, producer surplus, and...
 PL P 21. Problem 16 points Suppose Djibouti is a small part of the world market for hockey sticks and the capital is l-spanka a. (7 points) Draw a graph depicting the cuilibrium in the Dibouti hockey stick market in a world without trade, labeling everything, including the couilibrium price & quantity and both consumer & producer surplus. (You may create demand and supply schedules using numbers if you wish but you are not required to do so). Please show...
 whole question: Just answer as many as possible, dont have to be
100%
1. Consider the market for dried beans in a small town of 9,000 consumers. Let each consumer's preferences over beans (B, in pounds) and other goods (G) be given by U(B,G) = 120 +G For the rest of this question, fix the price of other goods at PG = 1 and let each consumer have a total weekly budget of I = 100. (a) Write the budget...
whole question: Just answer as many as possible, dont have to be
100%
1. Consider the market for dried beans in a small town of 9,000 consumers. Let each consumer's preferences over beans (B, in pounds) and other goods (G) be given by U(B,G) = 120 +G For the rest of this question, fix the price of other goods at PG = 1 and let each consumer have a total weekly budget of I = 100. (a) Write the budget...
 Part II: Market Failure in the Passenger Airline Industry and Policy (30%) For full marks: Craphs: Plot graphs to scale on graph paper by hand, include a figure number, title, and label all axis including correct units, be neat and tidy and put in order in the assignment. Introduce the graph with a sentence before it. 2) For algebra, use short sentences to guide the reader (SSTGR) through your work. Example: "To find the perfectly competitive market equilibrium global daily...
 13) The cost the Almy type of market 7) The market is an example of A) mattress: a monopoly B) com a perfectly competitive C) car insurance an oligopoly D) cell phone; a perfectly competitive 5) airplane manufacturing a monopolistically competitive 8) What is the difference between perfect competition and monopolistic competition? A) Perfect competition has a large number of small firms while monopolistic competition does not in monopolistic competition, firms produce identical goods, while in perfect competition, firms produce...
 Question 2 (15 points) Continuing your analysis of the competitive US manufacturing industry from Question 1, with demand of Q = 200-P and supply of Q. = P-20, suppose a technological innovation causes the supply curve to shift down by $20 for every given quantity Q. • Depict the original supply, the new supply, and the original demand curves on the usual P, Q diagram. Label all intercepts. Clearly indicate and label the new market equilibrium. 2/8/2 compass 20 Mlinois.edu/bbcswebdavipid-4037356-dt-con020%20ECON528%20M6...
Most questions answered within 3 hours.
-
Write a program to solve the Josephus problem, with the following
modification:
Sample Input:
./a.out n...
asked 35 minutes ago -
At the start of a CD it is spinning at a rate of 525 rpm
(revolutions...
asked 1 hour ago -
4. Without doing any calculations, predict whether the observed
∆T would increase, decrease or remain the...
asked 2 hours ago -
Based on the range, which of the following sets of scores has
the greatest variability? 3,...
asked 3 hours ago -
Ripples in a pond travel at a velocity of 3 m/s with one peak
passing a...
asked 3 hours ago -
A man stands on the roof of a building of height 13.0 mm and
throws a...
asked 3 hours ago -
The extent to which assets are financed by borrowed funds and
other liabilities is indicated by:...
asked 4 hours ago -
Explain in detail
Germany is the fifth largest economy
explain what goods and services Germany specializes...
asked 4 hours ago -
The density of platinum is 21.45 g/mL. If a cube of platinum
with a mass of...
asked 4 hours ago -
Accounts Receivable
Sales
A/R Posting
Extended Sales Invoice
Packing Slip
Compare invoice to packing slip 2...
asked 4 hours ago -
Michaella, age 23, is a full-time law student and is claimed by
her parents as a...
asked 4 hours ago -
Why are polymers not typically casted into products?
asked 5 hours ago