


Homework Answers


Add Answer to:
These are all part of the same SPSS print out. Please
help.
To study whether or...
o pts Question 9 Suppose a random sample of 16 students had a mean height of...
 o pts Question 9 Suppose a random sample of 16 students had a mean height of 65.0 inches with a standard deviation of 4.1 inches. Estimate the population mean height of students using this sample, StatCrunch, and a 95% confidence level. Round the interval limits to the tenth. O 63.2 inches to 66.8 inches O 63.0 inches to 67.0 inches O 63.3 inches to 66.7 inches O 62.8 inches to 67.2 inches. Question 10 10 pts Suppose you wanted to...
please answer all question (2-5) thanks Question 2 1 pts As the number of hours a...
 please answer all question (2-5) thanks
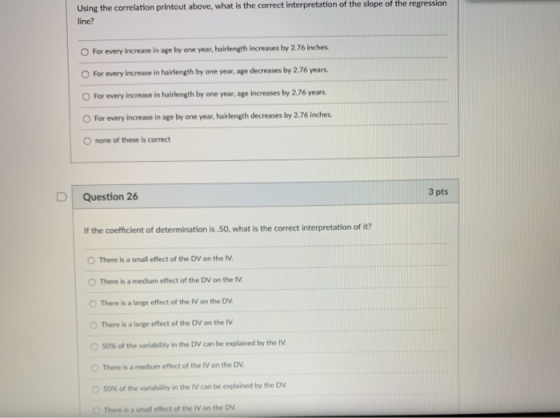
Question 2 1 pts As the number of hours a student studies increases, the number of errors made on the exam decreases. There is a strong relationship between these variables. Select the value for the pearson correlation (r) that would be appropriate 0-0.7 0-0.4 o 0.6 o 1.0 Question 3 1 pts The following APA summary was reported for a one-sample t-test (two-tailed, alpha = .05). t(15) = 3.3, p = .003 Which of...
please answer all question (2-5) thanks
Question 2 1 pts As the number of hours a student studies increases, the number of errors made on the exam decreases. There is a strong relationship between these variables. Select the value for the pearson correlation (r) that would be appropriate 0-0.7 0-0.4 o 0.6 o 1.0 Question 3 1 pts The following APA summary was reported for a one-sample t-test (two-tailed, alpha = .05). t(15) = 3.3, p = .003 Which of...
sseument Part& Pretected Viei)Word Mailings Review View Help Tell me what you want to do Enable Editing ruses. Unless you need to edit, it's safer to stay in Protected View 1. Two va...
 sseument Part& Pretected Viei)Word Mailings Review View Help Tell me what you want to do Enable Editing ruses. Unless you need to edit, it's safer to stay in Protected View 1. Two variables have a strong negative correlation. Which of the following statements is not true? a. the dependent variable decreases as the independent variable increases b. the trend of the data exhibits an irregular decline c. the line of best fit has a negative slope d. most data points...
0 Reference Mailing Review View Help codyl - 12-AAAA E 9 9ABCD Aatt BTU AaBbc Alice...
 0 Reference Mailing Review View Help codyl - 12-AAAA E 9 9ABCD Aatt BTU AaBbc Alice AaB XX A.P.A. EEZE -- Moma spediti? Paragraph 1. We perform correlational analyses to determine ? 2. What type of data are chi-squares used for?B a. Continuous b. Categorica 3. What type of question do chi-squares answer? a. Can we predict variable Y from variable ? b. What is the relationship between two variables? Are these var between two variables? Are these variables associated...
study of 360 women who lived in certain country found that there was roughly a linear relationship between y= life-leng...
 study of 360 women who lived in certain country found that there was roughly a linear relationship between y= life-length (in years) and x = number of sons the woman had, with a slope estimate of -0.83 (se 0.48). Answer parts a-c. Interpret the sign of the slope. Is the effect of having more boys good, or bad? O A. The positive sign of the slope indicates that as the number of boys increases, the life-length increases, so having more...
SPSS Homework 1 Instructions: Review and One-Way ANOVAs (40 points) Please note that for all problems...
SPSS Homework 1 Instructions: Review and One-Way ANOVAs (40 points) Please note that for all problems in this course, the standard cut-off (alpha) for a test of significance will be .05, and you always report the exact power unless SPSS output states p=.000 (you’d report p<.001). Also, remember that we divide the p value in half when reporting one-tailed tests with 1 – 2 groups. Problem Set 2: Pearson’s correlation (7 pts) Research Scenario: Is there a positive relationship between...
The tables below shows the results of a multiple linear regression analysis relating the sale price...
 The tables below shows the results of a multiple linear regression analysis relating the sale price y of a house (in dollars) versus LandVal (in dollars), Improvement (in dollars) and Area (in square feet): MS Source DF 877,967292656 46.66 100,349 6,272 978,316 0.00001 Regression 3 Residual16 Total 19 Predictor CoeffStd. ErrorT-valueP-value Intercept 1470 5746 0.26 0801 LandVal08145 0.5122 1.59 Improvement 0.8204 0.2112 3.88 2.05 0.131 0.001 Area 13.529 6.856 0.057 At alpha, a - 0.01 we can say that the...
PLEASE SHOW ALL EXCEL FORMULAS USED FOR EACH CALCULATIONS. A STEP BY STEP WALKTHROUGH OF HOW TO DO THE PROBLEM. Thank you so much for your help! Hours Feet Elevator Elevator code 24.00 545 Y...
 PLEASE SHOW ALL EXCEL FORMULAS USED FOR EACH CALCULATIONS. A
STEP BY STEP WALKTHROUGH OF HOW TO DO THE PROBLEM. Thank you so
much for your help!
Hours Feet Elevator Elevator
code
24.00 545 Yes 1
13.50 400 Yes 1
26.25 562 No 0
25.00 540 No 0
9.00 220 Yes 1
20.00 344 Yes 1
22.00 569 Yes 1
11.25 340 Yes 1
50.00 900 Yes 1
12.00 285 Yes 1
38.75 865 Yes 1
40.00 831 Yes 1...
PLEASE SHOW ALL EXCEL FORMULAS USED FOR EACH CALCULATIONS. A
STEP BY STEP WALKTHROUGH OF HOW TO DO THE PROBLEM. Thank you so
much for your help!
Hours Feet Elevator Elevator
code
24.00 545 Yes 1
13.50 400 Yes 1
26.25 562 No 0
25.00 540 No 0
9.00 220 Yes 1
20.00 344 Yes 1
22.00 569 Yes 1
11.25 340 Yes 1
50.00 900 Yes 1
12.00 285 Yes 1
38.75 865 Yes 1
40.00 831 Yes 1...
macroeconomic please solve it all i need help 8. If the price of coffee decreases, all...
 macroeconomic
please solve it all
i need help
8. If the price of coffee decreases, all else held coestant, the Law of Demand states that a firms will produce more coffee b. people will buy more coffee 9. If the price of coffee decreases, all else held constant, the Law of Supply states that a firms will produce more coffee b. people will buy more coffee e. firms will produce less coffee d people will buy more milk shakes c....
macroeconomic
please solve it all
i need help
8. If the price of coffee decreases, all else held coestant, the Law of Demand states that a firms will produce more coffee b. people will buy more coffee 9. If the price of coffee decreases, all else held constant, the Law of Supply states that a firms will produce more coffee b. people will buy more coffee e. firms will produce less coffee d people will buy more milk shakes c....
All of the following questions are in relation to the following journal article which is available...
 All of the following questions are in relation to the following journal article which is available on Moodle: Parr CL, Magnus MC, Karlstad O, Holvik K, Lund-Blix NA, Jaugen M, et al. Vitamin A and D intake in pregnancy, infant supplementation and asthma development: the Norwegian Mother and Child Cohort. Am J Clin Nutr 2018:107:789-798 QUESTIONS: 1. State one hypothesis the author's proposed in the manuscript. 2. There is previous research that shows that adequate Vitamin A intake is required...
 o pts Question 9 Suppose a random sample of 16 students had a mean height of 65.0 inches with a standard deviation of 4.1 inches. Estimate the population mean height of students using this sample, StatCrunch, and a 95% confidence level. Round the interval limits to the tenth. O 63.2 inches to 66.8 inches O 63.0 inches to 67.0 inches O 63.3 inches to 66.7 inches O 62.8 inches to 67.2 inches. Question 10 10 pts Suppose you wanted to...
 please answer all question (2-5) thanks
Question 2 1 pts As the number of hours a student studies increases, the number of errors made on the exam decreases. There is a strong relationship between these variables. Select the value for the pearson correlation (r) that would be appropriate 0-0.7 0-0.4 o 0.6 o 1.0 Question 3 1 pts The following APA summary was reported for a one-sample t-test (two-tailed, alpha = .05). t(15) = 3.3, p = .003 Which of...
please answer all question (2-5) thanks
Question 2 1 pts As the number of hours a student studies increases, the number of errors made on the exam decreases. There is a strong relationship between these variables. Select the value for the pearson correlation (r) that would be appropriate 0-0.7 0-0.4 o 0.6 o 1.0 Question 3 1 pts The following APA summary was reported for a one-sample t-test (two-tailed, alpha = .05). t(15) = 3.3, p = .003 Which of...
 sseument Part& Pretected Viei)Word Mailings Review View Help Tell me what you want to do Enable Editing ruses. Unless you need to edit, it's safer to stay in Protected View 1. Two variables have a strong negative correlation. Which of the following statements is not true? a. the dependent variable decreases as the independent variable increases b. the trend of the data exhibits an irregular decline c. the line of best fit has a negative slope d. most data points...
 0 Reference Mailing Review View Help codyl - 12-AAAA E 9 9ABCD Aatt BTU AaBbc Alice AaB XX A.P.A. EEZE -- Moma spediti? Paragraph 1. We perform correlational analyses to determine ? 2. What type of data are chi-squares used for?B a. Continuous b. Categorica 3. What type of question do chi-squares answer? a. Can we predict variable Y from variable ? b. What is the relationship between two variables? Are these var between two variables? Are these variables associated...
 study of 360 women who lived in certain country found that there was roughly a linear relationship between y= life-length (in years) and x = number of sons the woman had, with a slope estimate of -0.83 (se 0.48). Answer parts a-c. Interpret the sign of the slope. Is the effect of having more boys good, or bad? O A. The positive sign of the slope indicates that as the number of boys increases, the life-length increases, so having more...
 The tables below shows the results of a multiple linear regression analysis relating the sale price y of a house (in dollars) versus LandVal (in dollars), Improvement (in dollars) and Area (in square feet): MS Source DF 877,967292656 46.66 100,349 6,272 978,316 0.00001 Regression 3 Residual16 Total 19 Predictor CoeffStd. ErrorT-valueP-value Intercept 1470 5746 0.26 0801 LandVal08145 0.5122 1.59 Improvement 0.8204 0.2112 3.88 2.05 0.131 0.001 Area 13.529 6.856 0.057 At alpha, a - 0.01 we can say that the...
 PLEASE SHOW ALL EXCEL FORMULAS USED FOR EACH CALCULATIONS. A
STEP BY STEP WALKTHROUGH OF HOW TO DO THE PROBLEM. Thank you so
much for your help!
Hours Feet Elevator Elevator
code
24.00 545 Yes 1
13.50 400 Yes 1
26.25 562 No 0
25.00 540 No 0
9.00 220 Yes 1
20.00 344 Yes 1
22.00 569 Yes 1
11.25 340 Yes 1
50.00 900 Yes 1
12.00 285 Yes 1
38.75 865 Yes 1
40.00 831 Yes 1...
PLEASE SHOW ALL EXCEL FORMULAS USED FOR EACH CALCULATIONS. A
STEP BY STEP WALKTHROUGH OF HOW TO DO THE PROBLEM. Thank you so
much for your help!
Hours Feet Elevator Elevator
code
24.00 545 Yes 1
13.50 400 Yes 1
26.25 562 No 0
25.00 540 No 0
9.00 220 Yes 1
20.00 344 Yes 1
22.00 569 Yes 1
11.25 340 Yes 1
50.00 900 Yes 1
12.00 285 Yes 1
38.75 865 Yes 1
40.00 831 Yes 1...
 macroeconomic
please solve it all
i need help
8. If the price of coffee decreases, all else held coestant, the Law of Demand states that a firms will produce more coffee b. people will buy more coffee 9. If the price of coffee decreases, all else held constant, the Law of Supply states that a firms will produce more coffee b. people will buy more coffee e. firms will produce less coffee d people will buy more milk shakes c....
macroeconomic
please solve it all
i need help
8. If the price of coffee decreases, all else held coestant, the Law of Demand states that a firms will produce more coffee b. people will buy more coffee 9. If the price of coffee decreases, all else held constant, the Law of Supply states that a firms will produce more coffee b. people will buy more coffee e. firms will produce less coffee d people will buy more milk shakes c....
 All of the following questions are in relation to the following journal article which is available on Moodle: Parr CL, Magnus MC, Karlstad O, Holvik K, Lund-Blix NA, Jaugen M, et al. Vitamin A and D intake in pregnancy, infant supplementation and asthma development: the Norwegian Mother and Child Cohort. Am J Clin Nutr 2018:107:789-798 QUESTIONS: 1. State one hypothesis the author's proposed in the manuscript. 2. There is previous research that shows that adequate Vitamin A intake is required...
Most questions answered within 3 hours.
-
SQL help:
Design a database diagram for a database that stores information
about the Downloads that...
asked 52 minutes ago -
In 1970s and 1980s, molecular biologists discovered that the
hormone testosterone, binds a receptor protein that...
asked 3 hours ago -
january 1 2010 road catering service purchase a piece of
equipment for 58000 which is expected...
asked 3 hours ago -
Explain Mertons concept of anomie is and what the
modes of adaptation to it are?
asked 4 hours ago -
Jamie is doing a survey at her school about whether the students
feel the cafeteria food...
asked 5 hours ago -
How many liters of 0.669 M KOH will be needed to raise the pH of
0.339...
asked 8 hours ago -
A liquid of density 1270 kg/m 3 flows steadily through a pipe of
varying diameter and...
asked 8 hours ago -
Questions: What should the American executive do?
'A visiting American executive finds that a foreign subsidiary...
asked 8 hours ago -
Activity based costing was introduced as an alternative to
absorption costing.
1. Discuss using illustration the...
asked 8 hours ago -
1. You own shares of Crane DVD Company and are interested in
selling them. With so...
asked 8 hours ago -
How many grams of He are necessary to fill a balloon having a
volume of 4.5E3...
asked 8 hours ago -
The 2 patients, still in the hospital, were interviewed by a
MoH epidemiologist. The interviews revealed...
asked 8 hours ago