Two species of rat were grown under controlled conditions for 16 days and the following weight...
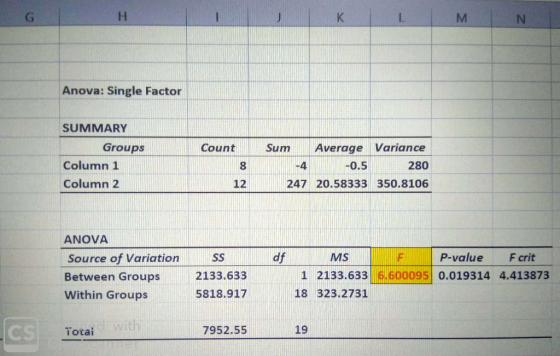
Two species of rat were grown under controlled conditions for 16 days and the following weight gains (in grams) were obtained. If the number is negative, it means the rat lost weight.
Species A -23 4 0 -18 7 32 -4 -2 Species B 21 38 20 24 24 58 16 -16 14 28 -5 25
| Species A | -23 | 4 | 0 | -18 | 7 | 32 | -4 | -2 | ||||
| Species B | 21 | 38 | 20 | 24 | 24 | 58 | 16 | -16 | 14 | 28 | -5 | 25 |
Using both a student’s t-test and a one-factor ANOVA (Hint, in JMP, use the fit y by x option, then pooled t/ANOVA).
a. What is the mathematical relationship between the value of F you obtain in the ANOVA and the value of “t” you obtain in the t-test ?
b. In this example, is there any advantage to using a t-test or an ANOVA? Is there a scenario where you may have an advantage using one test over the other?
Homework Answers
Answer:
Excel Output:

Explanation:

Add Answer to:
Two species of rat were grown under controlled conditions for 16
days and the following weight...
In an experiment where data from only two rat species are compared, is there any advantage...
In an experiment where data from only two rat species are compared, is there any advantage to using a t-test or an ANOVA? Is there a scenario where you may have an advantage using one test over the other?
4. A field recently fertilized with manure is believed to have caused excessive levels of nitrate...
 pls help!!
4. A field recently fertilized with manure is believed to have caused excessive levels of nitrate in an adjacent pond. Twenty-five samples were collected and analyzed using a field test kit. Conduct both the Dixon Ratio, and the Grubb's test to determine if there are any outliers present in the accompanying data set? Nitrate (mg/L) 1 Nitrate (mg/L) 25 29 34 21 38 26 38 83 37 38 34 34 26 28 24 24 26 10 12 13...
pls help!!
4. A field recently fertilized with manure is believed to have caused excessive levels of nitrate in an adjacent pond. Twenty-five samples were collected and analyzed using a field test kit. Conduct both the Dixon Ratio, and the Grubb's test to determine if there are any outliers present in the accompanying data set? Nitrate (mg/L) 1 Nitrate (mg/L) 25 29 34 21 38 26 38 83 37 38 34 34 26 28 24 24 26 10 12 13...
Refer to graph- fill in empty boxes Infant 1 Infant 2 Weight Length (kg) (cm) Weight...
 Refer to graph- fill in empty boxes
Infant 1 Infant 2 Weight Length (kg) (cm) Weight Length Weight | Length (kg) Weight Length %ile Age Date Age Date (cm) %ile %ile %ile mo mo 10.4.11 3.15 4.8.1 3.20 49.5 52.1 DOB 1 DOB 61.0 59.0 7.6.1 6.49 1.6.12 5.08 1 10.12 8.30 67.0 6.07 4.4.12 62.7 11 10.11.1 7.55 10.06 71.1 4.11 76.3 12 2 10.5 4.10.13 8.42 76.0 12.76 85.2 12 Birth to 24 months: Girls NAME Length-for-age and...
Refer to graph- fill in empty boxes
Infant 1 Infant 2 Weight Length (kg) (cm) Weight Length Weight | Length (kg) Weight Length %ile Age Date Age Date (cm) %ile %ile %ile mo mo 10.4.11 3.15 4.8.1 3.20 49.5 52.1 DOB 1 DOB 61.0 59.0 7.6.1 6.49 1.6.12 5.08 1 10.12 8.30 67.0 6.07 4.4.12 62.7 11 10.11.1 7.55 10.06 71.1 4.11 76.3 12 2 10.5 4.10.13 8.42 76.0 12.76 85.2 12 Birth to 24 months: Girls NAME Length-for-age and...
Notes: For part i.) Let T= weight of Peterbilt, V= weight of Volkswagen, F= weight of...
 Notes:
For part i.) Let T= weight of Peterbilt,
V= weight of Volkswagen, F= weight of
Ford
"three" Volkswagen means
sample from V not 3V.
For part iii) Use the following table
Vol<sWasen A shipping company has a large fleet of Peterbilt, T trucks. The distribution of weights in lb of these trucks from Peterbilt, Volkswagen and Ford are N(580, 225), N (100,64) and N(120, 81), respectively, and are independent. i. If one Peterbilt truck, three Volkswagen trucks and...
Notes:
For part i.) Let T= weight of Peterbilt,
V= weight of Volkswagen, F= weight of
Ford
"three" Volkswagen means
sample from V not 3V.
For part iii) Use the following table
Vol<sWasen A shipping company has a large fleet of Peterbilt, T trucks. The distribution of weights in lb of these trucks from Peterbilt, Volkswagen and Ford are N(580, 225), N (100,64) and N(120, 81), respectively, and are independent. i. If one Peterbilt truck, three Volkswagen trucks and...
It appears that sons of fathers who display low self-esteem tend to develop low self-esteem as...
It appears that sons of fathers who display low self-esteem tend to develop low self-esteem as well. Kuya conducted a study to test this hypothesis, since he is pretty sure that there must be a difference between the two groups, with sons having higher self-esteem than their fathers. He measured the self-esteem of the fathers and their sons using the Fearful Insecure Neurotic Emotional (FINE) test. The higher the score, the lower is the self-esteem. Is there a significant difference?...
pls help!! 4. A field recently fertilized with manure is believed to have caused excessive levels...
 pls help!!
4. A field recently fertilized with manure is believed to have caused excessive levels of nitrate in an adjacent pond. Twenty-five samples were collected and analyzed using a field test kit. Conduct both the Dixon Ratio, and the Grubb's test to determine if there are any outliers present in the accompanying data set? Nitrate (mg/L) 1 Nitrate (mg/L) 25 29 34 21 38 26 38 83 37 38 34 34 26 28 24 24 26 10 12 13...
pls help!!
4. A field recently fertilized with manure is believed to have caused excessive levels of nitrate in an adjacent pond. Twenty-five samples were collected and analyzed using a field test kit. Conduct both the Dixon Ratio, and the Grubb's test to determine if there are any outliers present in the accompanying data set? Nitrate (mg/L) 1 Nitrate (mg/L) 25 29 34 21 38 26 38 83 37 38 34 34 26 28 24 24 26 10 12 13...
can someone take a look to these 3 pictures and fill in the blanks. I need...
 can someone take a look to these 3 pictures and fill
in the blanks. I need to show work and understand the answers.
thank you!
Birth to 36 months: Girls Head circumference-for-age and Welght-for-length percentiles NAME RECORD # Birth 3 69 12 15 18 21 24 27 30 33 36 AGE (MONTHS cm in ina cm 52 19--48 46 46-18 42 50 22 48 15--38 2044 19--42 18-40 38 36 34 -32 13 16 13 28 E 11 24 H...
can someone take a look to these 3 pictures and fill
in the blanks. I need to show work and understand the answers.
thank you!
Birth to 36 months: Girls Head circumference-for-age and Welght-for-length percentiles NAME RECORD # Birth 3 69 12 15 18 21 24 27 30 33 36 AGE (MONTHS cm in ina cm 52 19--48 46 46-18 42 50 22 48 15--38 2044 19--42 18-40 38 36 34 -32 13 16 13 28 E 11 24 H...
An experiment was conducted to investigate warping of copper plates. The two factors studied were the...
 An experiment was conducted to investigate warping of copper plates. The two factors studied were the copper contents (A) and the temperature (B) of the copper plates. The response variable was a measure of the amount of warping. Using alpha-05. is main effect B significant? What are the values of Fo and Fert for B? Results at four (4) decimal places Response: warping in copper plates (mm) A: Copper content (9) B: Temperature (0 40 60 80 100 50 17...
Conduct a formal hypothesis test of the claim that the mean longevity is less than 57...
Conduct a formal hypothesis test of the claim that the mean longevity is less than 57 days. Test at significance α=0.05. Your written summary of this test must include the following: Your null and alternate hypotheses in the proper format. The type of distribution you used to construct the interval (t or normal). The P-value and its logical relationship to α (≤ or >). Your decision regarding the null hypothesis: reject or fail to reject. A statement regarding the sufficiency/insufficiency...
You are studying an invasive insect species in the USA. Understanding where invasive species comes from can help with management (e.g., importation of native natural enemies for biocontrol). The graph...
 You are studying an invasive insect species in the USA.
Understanding where invasive species comes from can help with
management (e.g., importation of native natural enemies for
biocontrol). The graph below shows output from a STRUCTURE analysis
of 10 microsatellite markers in 50 individuals taken from the
invasive US population, and the three native countries of origin,
Spain, France, and Italy. A-1pt) How many genetic groups, or
clusters, were identified in the analysis? Assuming you’ve completely
sampled the native range...
You are studying an invasive insect species in the USA.
Understanding where invasive species comes from can help with
management (e.g., importation of native natural enemies for
biocontrol). The graph below shows output from a STRUCTURE analysis
of 10 microsatellite markers in 50 individuals taken from the
invasive US population, and the three native countries of origin,
Spain, France, and Italy. A-1pt) How many genetic groups, or
clusters, were identified in the analysis? Assuming you’ve completely
sampled the native range...
 pls help!!
4. A field recently fertilized with manure is believed to have caused excessive levels of nitrate in an adjacent pond. Twenty-five samples were collected and analyzed using a field test kit. Conduct both the Dixon Ratio, and the Grubb's test to determine if there are any outliers present in the accompanying data set? Nitrate (mg/L) 1 Nitrate (mg/L) 25 29 34 21 38 26 38 83 37 38 34 34 26 28 24 24 26 10 12 13...
pls help!!
4. A field recently fertilized with manure is believed to have caused excessive levels of nitrate in an adjacent pond. Twenty-five samples were collected and analyzed using a field test kit. Conduct both the Dixon Ratio, and the Grubb's test to determine if there are any outliers present in the accompanying data set? Nitrate (mg/L) 1 Nitrate (mg/L) 25 29 34 21 38 26 38 83 37 38 34 34 26 28 24 24 26 10 12 13...
 Refer to graph- fill in empty boxes
Infant 1 Infant 2 Weight Length (kg) (cm) Weight Length Weight | Length (kg) Weight Length %ile Age Date Age Date (cm) %ile %ile %ile mo mo 10.4.11 3.15 4.8.1 3.20 49.5 52.1 DOB 1 DOB 61.0 59.0 7.6.1 6.49 1.6.12 5.08 1 10.12 8.30 67.0 6.07 4.4.12 62.7 11 10.11.1 7.55 10.06 71.1 4.11 76.3 12 2 10.5 4.10.13 8.42 76.0 12.76 85.2 12 Birth to 24 months: Girls NAME Length-for-age and...
Refer to graph- fill in empty boxes
Infant 1 Infant 2 Weight Length (kg) (cm) Weight Length Weight | Length (kg) Weight Length %ile Age Date Age Date (cm) %ile %ile %ile mo mo 10.4.11 3.15 4.8.1 3.20 49.5 52.1 DOB 1 DOB 61.0 59.0 7.6.1 6.49 1.6.12 5.08 1 10.12 8.30 67.0 6.07 4.4.12 62.7 11 10.11.1 7.55 10.06 71.1 4.11 76.3 12 2 10.5 4.10.13 8.42 76.0 12.76 85.2 12 Birth to 24 months: Girls NAME Length-for-age and...
 Notes:
For part i.) Let T= weight of Peterbilt,
V= weight of Volkswagen, F= weight of
Ford
"three" Volkswagen means
sample from V not 3V.
For part iii) Use the following table
Vol<sWasen A shipping company has a large fleet of Peterbilt, T trucks. The distribution of weights in lb of these trucks from Peterbilt, Volkswagen and Ford are N(580, 225), N (100,64) and N(120, 81), respectively, and are independent. i. If one Peterbilt truck, three Volkswagen trucks and...
Notes:
For part i.) Let T= weight of Peterbilt,
V= weight of Volkswagen, F= weight of
Ford
"three" Volkswagen means
sample from V not 3V.
For part iii) Use the following table
Vol<sWasen A shipping company has a large fleet of Peterbilt, T trucks. The distribution of weights in lb of these trucks from Peterbilt, Volkswagen and Ford are N(580, 225), N (100,64) and N(120, 81), respectively, and are independent. i. If one Peterbilt truck, three Volkswagen trucks and...
 pls help!!
4. A field recently fertilized with manure is believed to have caused excessive levels of nitrate in an adjacent pond. Twenty-five samples were collected and analyzed using a field test kit. Conduct both the Dixon Ratio, and the Grubb's test to determine if there are any outliers present in the accompanying data set? Nitrate (mg/L) 1 Nitrate (mg/L) 25 29 34 21 38 26 38 83 37 38 34 34 26 28 24 24 26 10 12 13...
pls help!!
4. A field recently fertilized with manure is believed to have caused excessive levels of nitrate in an adjacent pond. Twenty-five samples were collected and analyzed using a field test kit. Conduct both the Dixon Ratio, and the Grubb's test to determine if there are any outliers present in the accompanying data set? Nitrate (mg/L) 1 Nitrate (mg/L) 25 29 34 21 38 26 38 83 37 38 34 34 26 28 24 24 26 10 12 13...
 can someone take a look to these 3 pictures and fill
in the blanks. I need to show work and understand the answers.
thank you!
Birth to 36 months: Girls Head circumference-for-age and Welght-for-length percentiles NAME RECORD # Birth 3 69 12 15 18 21 24 27 30 33 36 AGE (MONTHS cm in ina cm 52 19--48 46 46-18 42 50 22 48 15--38 2044 19--42 18-40 38 36 34 -32 13 16 13 28 E 11 24 H...
can someone take a look to these 3 pictures and fill
in the blanks. I need to show work and understand the answers.
thank you!
Birth to 36 months: Girls Head circumference-for-age and Welght-for-length percentiles NAME RECORD # Birth 3 69 12 15 18 21 24 27 30 33 36 AGE (MONTHS cm in ina cm 52 19--48 46 46-18 42 50 22 48 15--38 2044 19--42 18-40 38 36 34 -32 13 16 13 28 E 11 24 H...
 An experiment was conducted to investigate warping of copper plates. The two factors studied were the copper contents (A) and the temperature (B) of the copper plates. The response variable was a measure of the amount of warping. Using alpha-05. is main effect B significant? What are the values of Fo and Fert for B? Results at four (4) decimal places Response: warping in copper plates (mm) A: Copper content (9) B: Temperature (0 40 60 80 100 50 17...
 You are studying an invasive insect species in the USA.
Understanding where invasive species comes from can help with
management (e.g., importation of native natural enemies for
biocontrol). The graph below shows output from a STRUCTURE analysis
of 10 microsatellite markers in 50 individuals taken from the
invasive US population, and the three native countries of origin,
Spain, France, and Italy. A-1pt) How many genetic groups, or
clusters, were identified in the analysis? Assuming you’ve completely
sampled the native range...
You are studying an invasive insect species in the USA.
Understanding where invasive species comes from can help with
management (e.g., importation of native natural enemies for
biocontrol). The graph below shows output from a STRUCTURE analysis
of 10 microsatellite markers in 50 individuals taken from the
invasive US population, and the three native countries of origin,
Spain, France, and Italy. A-1pt) How many genetic groups, or
clusters, were identified in the analysis? Assuming you’ve completely
sampled the native range...
Most questions answered within 3 hours.
-
On December 31, 2016, the shareholders’ equity section of the
balance sheet of R & L...
asked 3 minutes ago -
16.7
At t=0s a small "upward" (positive y) pulse centered at x = 5.0
m is...
asked 16 minutes ago -
Twitter Users and News: A poll conducted in 2013 found that 52%
of U.S. adult Twitter...
asked 31 minutes ago -
How
would I know whether a given amino acid has an ionizable group or
not? please...
asked 39 minutes ago -
True or false?
True False The function of the enzyme acyl CoA
synthetase is the ATP-dependent coupling...
asked 39 minutes ago -
Nadia Corporation adjusts its debt so that its interest coverage
(EBIT/Interest) remains constant at 3. Nadia’s...
asked 41 minutes ago -
In a clinical trial, 20 out of 600 patients taking a
prescription drug complained of flulike...
asked 47 minutes ago -
7. How many types of nuclear processes can produce energy? 8.
How many types of radioactive...
asked 51 minutes ago -
For both the Sn2 and Sn1 reaction
conditions:
Structure | Rxn (Y/N) at room T° Rxn...
asked 52 minutes ago -
11. In cell N2, enter a formula using the IF function and a
structured reference to...
asked 51 minutes ago -
There is X-linked mutations in flies in this example. You need
to determine the inheritence pattern...
asked 53 minutes ago -
1) There is a 5.0 μC charge at each of 3 corners of a square
(each...
asked 1 hour ago