
Homework Answers


Add Answer to:
3. The Fig. P3.1 shows a single-line diagram of a three-phase power system. Suppose Pp2 -...
The single-line diagram of a three-phase five-bus power system is shown in Fig.1. All lines have ...
 The single-line diagram of a three-phase five-bus power system is shown in Fig.1. All lines have an impedance 0.0099+0.0990j pu. Line charging (capacitive) admittance can be neglected. 2-0.8830 30.2076 SD3-0.2+j0.1 SD3-1.7137+j0.5983 Sos-1.7355+j0.5496 Pe5 -0.5 G Qg5 -0.2 Fig. 1 a) Find the Ybus matrix of this system. b) Classify the buses in this system as slack, PV or PQ bus c) For each bus, state the given and unknown power flow variables. d) Find the net power injection (scheduled power)...
Q2 (Newton-Raphson Power Flow Solution with FACTS Devices Consider a two-bus system with the sing...
 do it in Matlab
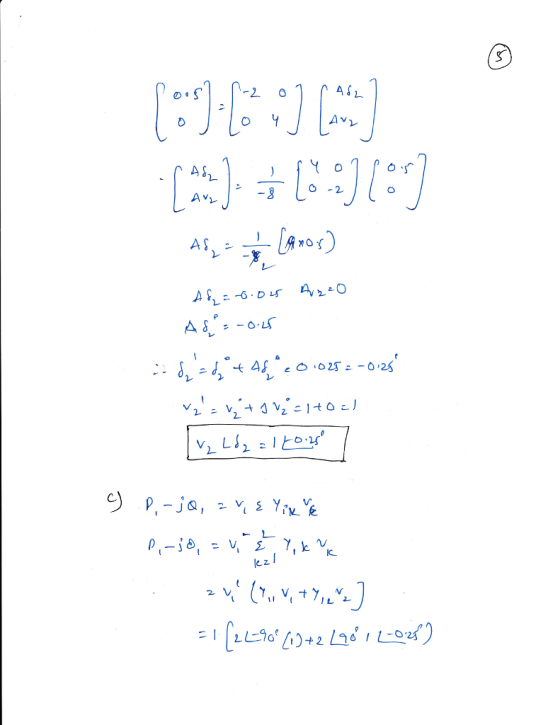
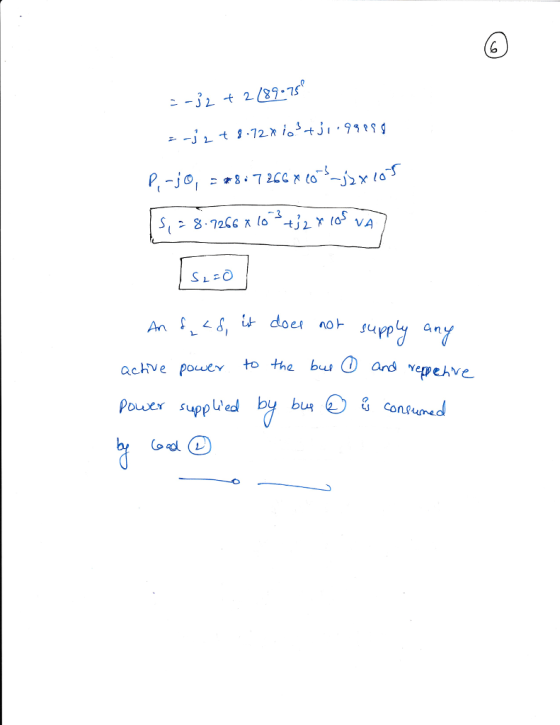
Q2 (Newton-Raphson Power Flow Solution with FACTS Devices Consider a two-bus system with the single-line diagram shown in Fig. 2. In the two bus system, Bus is slack bus where voltage is given: V 1.03 +j0.0 p. u. Bus 2 is a PQ bus where load power is given in p.u.. The impedance of the transmission line between bus 1 and bus 2 is 212-0.0+ j0.15 p.u. A STATCOM is connected at bus 2 through a...
do it in Matlab
Q2 (Newton-Raphson Power Flow Solution with FACTS Devices Consider a two-bus system with the single-line diagram shown in Fig. 2. In the two bus system, Bus is slack bus where voltage is given: V 1.03 +j0.0 p. u. Bus 2 is a PQ bus where load power is given in p.u.. The impedance of the transmission line between bus 1 and bus 2 is 212-0.0+ j0.15 p.u. A STATCOM is connected at bus 2 through a...
The single-line diagram of a three-phase live-bus power system is shown in Fig. 1. All lines...
 The single-line diagram of a three-phase live-bus power system is shown in Fig. 1. All lines have an impedance 0.0099 + 0.0990j pu. Line charging admittance can be neglected. a) Find the Ybus matrix of this system. b) Classify the buses in this system as slack, PV or PQ bus. c) For each bus, state the given and unknown power how variables. d) Find the net power Injection (scheduled power) for buses 2, 3, 4, and 5.
Question 1: A single line diagram of a three-bus power system is shown in Fig 1....
 Question 1: A single line diagram of a three-bus power system is shown in Fig 1. Bus 1 is the slack bus with a voltage of 1.020 per unit, bus 2 is a voltage-controlled bus (PV-bus) with a voltage magnitude of 1.05 pu and real generated power of 1 00 MWand the reactive power in the range Q.(20MVAR) < Q<Q-60M¥AR .BUS 3 is PQ bus with P 300 MW and Q= 200 Mvar. Take 100 MVÅ susceptance are neglected as...
2. Consider the three-bus system shown in Fig. P2.1 with 1 Lj02 pu the per unit line reactances i...
 Please Write clearly
2. Consider the three-bus system shown in Fig. P2.1 with 1 Lj02 pu the per unit line reactances indicated on the figure. The magnitude of all the three-bus voltages are specified to be 1.0 pu. The bus powers are specified in the Table P2.1. 0.2 pu Fig. P2.1 Table P2.1 Reactive Demand Demand Generation Reactive Generation ea Real Gi (Unspecified) 1 PDI 1.0 DI 0.6 PGI? 2 PD2- 0 D2-0 PG2.4G2 (Unspecified) 3 PD3-1.0 D3 .0 PG30...
Please Write clearly
2. Consider the three-bus system shown in Fig. P2.1 with 1 Lj02 pu the per unit line reactances indicated on the figure. The magnitude of all the three-bus voltages are specified to be 1.0 pu. The bus powers are specified in the Table P2.1. 0.2 pu Fig. P2.1 Table P2.1 Reactive Demand Demand Generation Reactive Generation ea Real Gi (Unspecified) 1 PDI 1.0 DI 0.6 PGI? 2 PD2- 0 D2-0 PG2.4G2 (Unspecified) 3 PD3-1.0 D3 .0 PG30...
The one line diagram of a three-phase power system is shown in Fig.8. Impedances are marked...
 The one line diagram of a three-phase power system is shown in
Fig.8. Impedances are marked in per unit on a 100 MW, 400 kV base.
The Load at Bus 2 is S2 = 15.93 MW - j33.4Mvar, and at Bus 3 is S3
= 77 MW + j14 Mvar. It is required to hold the voltage at Bus 3 at
400 kV, Angle 0 degs. Working in per unit, determine the voltages
at Buses 2 and 1.
Q8: The...
The one line diagram of a three-phase power system is shown in
Fig.8. Impedances are marked in per unit on a 100 MW, 400 kV base.
The Load at Bus 2 is S2 = 15.93 MW - j33.4Mvar, and at Bus 3 is S3
= 77 MW + j14 Mvar. It is required to hold the voltage at Bus 3 at
400 kV, Angle 0 degs. Working in per unit, determine the voltages
at Buses 2 and 1.
Q8: The...
3- The figure given below shows the one line diagram of a simple power system. Line impedançe is given in per unit...
 3- The figure given below shows the one line diagram of a simple power system. Line impedançe is given in per unit on a 100 MVA base. a. Find the unknown bus voltage by using Newton Raphson method with one iteration. IE you need Ssum you can use San-100 MVA. (20 pts) b. If after several iterations the bus voltage converge to V09-j0.1 pu, determine the power loss in the line and the bus 1 real and reactive power. (15...
The Fig. P2.1 shows the one-line diagram of a simple four-bus system. Table P2.1 gives the...
 The Fig. P2.1 shows the one-line diagram of a simple four-bus system. Table P2.1 gives the line impedances identified by the buses on which these terminate. The shunt admittance at all the buses is assumed negligible (a) Obtain the bus admittance Ygus assuming that the line shown dotted is not connected (b) (i) What modifications need to be carried out in「BUs If the dotted line is now connected? The impedance of the line is (0.01 +j0.1) pu (ii) obtain the...
#1(i) For the one line 3-phse power system shown in Fig.1, show that the real power,...
 #1(i) For the one line 3-phse power system shown in Fig.1, show that the real power, P in per unit, delivered to bus-2 by the generator, is P = (I Egl IVrl sin δ)/(Xg + Xr), where Eg, is the generated voltage of the alternator in per unit and Xg its synchronous reactance in per unit, V, is the bus-2 voltage at the receiving end of the transmission line with reactance x, all in per unit, and δ is the...
Consider the single line diagram of a 3-bus power system shown in Figure 2. Slack bus...
 Consider the single line diagram of a 3-bus power system shown in Figure 2. Slack bus 3 Figure 2. The data for this system are given in Tables 1 and 2. Bus Table 1 Generation Load Assumed PG QGPLQL bus voltage (MW) (MVar) (MW) (MVar) 1.05 +10.0 - - 1.0 + 0.0 50 30 305.6 140.2 1.0 +0.0 0.0 0.0 138.6 45.2 slack bus) Table 2 Bus-to-bus Impedance 0.2 + j0.04 .01 +0.03 2.3 0.0125 + j0.025 (0) Convert all...
 The single-line diagram of a three-phase five-bus power system is shown in Fig.1. All lines have an impedance 0.0099+0.0990j pu. Line charging (capacitive) admittance can be neglected. 2-0.8830 30.2076 SD3-0.2+j0.1 SD3-1.7137+j0.5983 Sos-1.7355+j0.5496 Pe5 -0.5 G Qg5 -0.2 Fig. 1 a) Find the Ybus matrix of this system. b) Classify the buses in this system as slack, PV or PQ bus c) For each bus, state the given and unknown power flow variables. d) Find the net power injection (scheduled power)...
 do it in Matlab
Q2 (Newton-Raphson Power Flow Solution with FACTS Devices Consider a two-bus system with the single-line diagram shown in Fig. 2. In the two bus system, Bus is slack bus where voltage is given: V 1.03 +j0.0 p. u. Bus 2 is a PQ bus where load power is given in p.u.. The impedance of the transmission line between bus 1 and bus 2 is 212-0.0+ j0.15 p.u. A STATCOM is connected at bus 2 through a...
do it in Matlab
Q2 (Newton-Raphson Power Flow Solution with FACTS Devices Consider a two-bus system with the single-line diagram shown in Fig. 2. In the two bus system, Bus is slack bus where voltage is given: V 1.03 +j0.0 p. u. Bus 2 is a PQ bus where load power is given in p.u.. The impedance of the transmission line between bus 1 and bus 2 is 212-0.0+ j0.15 p.u. A STATCOM is connected at bus 2 through a...
 The single-line diagram of a three-phase live-bus power system is shown in Fig. 1. All lines have an impedance 0.0099 + 0.0990j pu. Line charging admittance can be neglected. a) Find the Ybus matrix of this system. b) Classify the buses in this system as slack, PV or PQ bus. c) For each bus, state the given and unknown power how variables. d) Find the net power Injection (scheduled power) for buses 2, 3, 4, and 5.
 Question 1: A single line diagram of a three-bus power system is shown in Fig 1. Bus 1 is the slack bus with a voltage of 1.020 per unit, bus 2 is a voltage-controlled bus (PV-bus) with a voltage magnitude of 1.05 pu and real generated power of 1 00 MWand the reactive power in the range Q.(20MVAR) < Q<Q-60M¥AR .BUS 3 is PQ bus with P 300 MW and Q= 200 Mvar. Take 100 MVÅ susceptance are neglected as...
 Please Write clearly
2. Consider the three-bus system shown in Fig. P2.1 with 1 Lj02 pu the per unit line reactances indicated on the figure. The magnitude of all the three-bus voltages are specified to be 1.0 pu. The bus powers are specified in the Table P2.1. 0.2 pu Fig. P2.1 Table P2.1 Reactive Demand Demand Generation Reactive Generation ea Real Gi (Unspecified) 1 PDI 1.0 DI 0.6 PGI? 2 PD2- 0 D2-0 PG2.4G2 (Unspecified) 3 PD3-1.0 D3 .0 PG30...
Please Write clearly
2. Consider the three-bus system shown in Fig. P2.1 with 1 Lj02 pu the per unit line reactances indicated on the figure. The magnitude of all the three-bus voltages are specified to be 1.0 pu. The bus powers are specified in the Table P2.1. 0.2 pu Fig. P2.1 Table P2.1 Reactive Demand Demand Generation Reactive Generation ea Real Gi (Unspecified) 1 PDI 1.0 DI 0.6 PGI? 2 PD2- 0 D2-0 PG2.4G2 (Unspecified) 3 PD3-1.0 D3 .0 PG30...
 The one line diagram of a three-phase power system is shown in
Fig.8. Impedances are marked in per unit on a 100 MW, 400 kV base.
The Load at Bus 2 is S2 = 15.93 MW - j33.4Mvar, and at Bus 3 is S3
= 77 MW + j14 Mvar. It is required to hold the voltage at Bus 3 at
400 kV, Angle 0 degs. Working in per unit, determine the voltages
at Buses 2 and 1.
Q8: The...
The one line diagram of a three-phase power system is shown in
Fig.8. Impedances are marked in per unit on a 100 MW, 400 kV base.
The Load at Bus 2 is S2 = 15.93 MW - j33.4Mvar, and at Bus 3 is S3
= 77 MW + j14 Mvar. It is required to hold the voltage at Bus 3 at
400 kV, Angle 0 degs. Working in per unit, determine the voltages
at Buses 2 and 1.
Q8: The...
 3- The figure given below shows the one line diagram of a simple power system. Line impedançe is given in per unit on a 100 MVA base. a. Find the unknown bus voltage by using Newton Raphson method with one iteration. IE you need Ssum you can use San-100 MVA. (20 pts) b. If after several iterations the bus voltage converge to V09-j0.1 pu, determine the power loss in the line and the bus 1 real and reactive power. (15...
 The Fig. P2.1 shows the one-line diagram of a simple four-bus system. Table P2.1 gives the line impedances identified by the buses on which these terminate. The shunt admittance at all the buses is assumed negligible (a) Obtain the bus admittance Ygus assuming that the line shown dotted is not connected (b) (i) What modifications need to be carried out in「BUs If the dotted line is now connected? The impedance of the line is (0.01 +j0.1) pu (ii) obtain the...
 #1(i) For the one line 3-phse power system shown in Fig.1, show that the real power, P in per unit, delivered to bus-2 by the generator, is P = (I Egl IVrl sin δ)/(Xg + Xr), where Eg, is the generated voltage of the alternator in per unit and Xg its synchronous reactance in per unit, V, is the bus-2 voltage at the receiving end of the transmission line with reactance x, all in per unit, and δ is the...
 Consider the single line diagram of a 3-bus power system shown in Figure 2. Slack bus 3 Figure 2. The data for this system are given in Tables 1 and 2. Bus Table 1 Generation Load Assumed PG QGPLQL bus voltage (MW) (MVar) (MW) (MVar) 1.05 +10.0 - - 1.0 + 0.0 50 30 305.6 140.2 1.0 +0.0 0.0 0.0 138.6 45.2 slack bus) Table 2 Bus-to-bus Impedance 0.2 + j0.04 .01 +0.03 2.3 0.0125 + j0.025 (0) Convert all...
Most questions answered within 3 hours.
-
If you’re standing at the bottom of a hill and asked to evaluate
it while being...
asked 31 minutes ago -
1. Which region has taken the lead in the world of
e-waste handling?
a) European Union...
asked 25 minutes ago -
A 8.15- g bullet from a 9-mm pistol has a velocity of 366.0 m/s.
It strikes...
asked 1 hour ago -
The outstanding bonds of Alpha Extracts have a yield to maturity
of 7.4 percent and a...
asked 1 hour ago -
The Problem: The Case of the Harmonizing Vacations
Your CEO is exploring partnering with a European...
asked 3 hours ago -
A chemical equation is balanced by adding coefficients in front
of some formulas so that the...
asked 3 hours ago -
From the literature (reference your sources): What are the
lattice parameters of calcite and aragonite? Why...
asked 3 hours ago -
Your system is rejecting the question am asking which is
preceded by a case study. It...
asked 4 hours ago -
3. On January 2, 2000, Larry creates a trust with himself as
trustee. Larry as trustee...
asked 3 hours ago -
A member of the volleyball team spikes the ball. During this
process, she changes the velocity...
asked 4 hours ago -
Are adult gamers less likely to use a gaming console (Xbox,
PlayStation, Wii, etc...) than teen...
asked 4 hours ago -
The University of
Texas recently reported that 43% of college students aged 18-24
would spend their...
asked 5 hours ago